Forward Testing

ivot

Member
Messages
61
Likes
5
I see that we have a thread going with some good discussion on backtesting, but I wanted to ask about going forward in time, specifically, how do you evaluate forward testing? Here's my situation.

For the past 6 months I've been forward testing on paper a system that I developed for commodities. The trades are all one day trades, enter on the market's open and exit on the close with no stops or profit targets. I don't think it's optimized. I've made 59 total trades over this 6 month time and the equity curve is pretty solid with a decent distribution There was large draw down near the start where I went negative but the system recovered nicely. I've had 26 losses and 33 wins. There haven't been any real big outliers.

If I could backtest this a year or two I would be pretty happy but I don't have anyway of doing that, so I'm pretty much stuck with just going forward. How long you would you folks take something like this forward? A year, 10 months, 2 years? I feel that since these are just one day trades that maybe my testing time doesn't need to be overly long, maybe another couple of months. I would like to get everyone's feedback and opinions though.
 
ivot, I don't understand why you can't backtest it (must be lack of data if it's mechanical). If you can't back test and the only option is to forward test, the issue is whether the system will work in different kinds of markets (bull/bear/sideways/hi volatility/lo volatility). If there really is no way of backtesting some people like to make synthetic data out of real data. I don't as it can destroy the anomily you're exploiting. All in all it's a case of valuating what you've got. Are you happy to trade it as is, or do you need more proof that it'll work.
 
The reasons why I can't back test this system are rather complicated but I might be able to figure something out in a couple of months. Until then, I think I need to give this a couple of more months to build my track record.
 
@Ivot,

I test the robustness of my mechanical trading systems with monte carlo simulation methods.

For me there are two main methods:

1. data simulation or generation of so-called "synthetic data" to extend your data base for back- or forward testing...

2. system simulation of testing results of your system (winners, losers, average win, average loss and and...)

An example for point 2): you have made 59 Trades in 6 months and got some results. So you can simulate e.g. a monte carlo simulation with 100 mcs runs = 5900 trades (that are 50 trading years in your case !) to see a direction of the robustness of your system...

Inspite of the case that I sell a low cost powerful mcs software, I offer also a freeware version and an alternative free Excel example on this website, so you can test it without risks:
http://www.zentrader.de/download.html

bye,
zentrader
 
I downloaded your freeware version of Monte Carlo and fired it up. I'm a little stuck though on the currency value / point and the number of bars (test dates). All my records are in excel and I have the date the trades was made (these are one day trades) and the profit or loss.

I had no problem entering the the number of winning and losing trades along with the average p/l but I wasn't sure what to enter for those other two boxes.
 
MCS Freeware

hi,
it's easy to fill the gap...

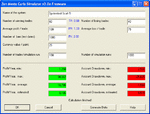
I've attached an example (example.gif)

First you can select a name for your simulation.
Then you input the number of your winning trades and your losing trades.
In the next two fields you input average win and average loss in points (future contract) or $.
In the next field you put in the number of data bars - in this example there are 1000 bars = 4 years of EOD data...
The next field currency value per point (perhaps a strange translation, because I'm german...) means only a multipicator for future contracts: e.g. for the S&P500-Future this value is 50($) per point, for the NASDAQ100 this value is 20($) per point, for the EUREX-DAX this is 25(Euro) per point and for normal stocks this value is 1.

The last to input fields are fields for the Monte Carlo Simulation method.

First you fix your simulation period. In the example there are 100 trades per trading period/range.

Second you select the number of trade period/range simulation runs. in the example the number of runs is 1000. That means, that the one run of 100 trades (perhaps one trading year) is simulated 1000 times = 1.000 trading years...

For a good MCS result it's important to simulate a sufficient big number of simulations, becuase the so-called "black swan", the trading year with an disastreous drawdown can arrive already in year one (!)...

I hope that this was helpful for you!

bye,
zentrader


ivot said:
I downloaded your freeware version of Monte Carlo and fired it up. I'm a little stuck though on the currency value / point and the number of bars (test dates). All my records are in excel and I have the date the trades was made (these are one day trades) and the profit or loss.

I had no problem entering the the number of winning and losing trades along with the average p/l but I wasn't sure what to enter for those other two boxes.
 

Attachments

  • mcs_example.gif
    mcs_example.gif
    14.5 KB · Views: 426
Top