Forex Cycle Analysis

4xis2ez

Well-known member
Messages
372
Likes
54
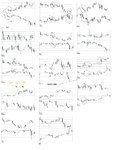
Future price movement in advance can be seen in my cycle analysis. Here are some of the cycles I am looking at now for future trading opportunities. Eurusd looks to be a shorting opportunity this coming week, however, be warned it is in a strong uptrend now.
 

Attachments

  • jan 2 plus 40.jpg
    jan 2 plus 40.jpg
    392.1 KB · Views: 338
Last edited:
I exited my eurnzd short due to it being oversold on the hourly chart and there could be a possible short covering squeeze. I got about +111 pips on that trade.

Now long nzdcad based on my cycle analysis.
 
Last edited:
Quite mind-boggling to see January's price candlesticks already printed on your dailies charts in the Youtube clip.

How the heck do you calculate OHLC for a day that's still weeks ahead? What are the other candlesticks on your charts?
 
Quite mind-boggling to see January's price candlesticks already printed on your dailies charts in the Youtube clip.

How the heck do you calculate OHLC for a day that's still weeks ahead? What are the other candlesticks on your charts?
Hi, thanks for your attention. The charts you see are past data or historical data. In other words, the markets are not random, the future repeats the past based on certain intervals of time which I discovered. The dates on the charts are future dates where I expect highs and lows occur in terms of time. This does not tell you how far a market will move. It may move 10 pips, or 300 pips, that I don't know. I just know how to time market price moves.
 
Here is my cycle analysis of the SP500.
 

Attachments

  • sp jan 2 plus 40.jpg
    sp jan 2 plus 40.jpg
    69.6 KB · Views: 245
Well, OK, but not random doesn't mean predictable. What are the data you take account of to derive future high / low dates?
 
Well, OK, but not random doesn't mean predictable. What are the data you take account of to derive future high / low dates?

I have shown my cycle work to Larry Williams without telling him how it's done. I intend to sell it to him if he likes it.
 
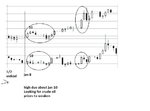
New regarding usdcad cycle. Looking to go long.
 
Last edited:
Now long usdcad as per my cycle analysis.
 

Attachments

  • forum.jpg
    forum.jpg
    77.7 KB · Views: 267
  • forum1.jpg
    forum1.jpg
    38.8 KB · Views: 280
Last edited:
I passed the FTMO Challenge. I go into Verification and if I pass that, i'll get a $10k account to trade where they pay me 70% of profits. I'll try to post my cycle analysis more often.
forum.jpg
 
Next trade is shorting eurusd around February 5. My cycle analysis is shown why I am looking for this trade. Opps, lost the chart.
 
Last edited:
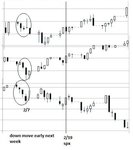
There is also a possible trade shorting stock indexes early next week. Historical charts show the expected move in the attachment.
 

Attachments

  • forum.jpg
    forum.jpg
    24.1 KB · Views: 190
I also see some potential for shortening eurusd. However, I think that currently market is looking at fundamentals. There are some economic and political issues putting pressure on both currencies. I am waiting still for confirmation of trend
 
Hi, thanks for your attention. The charts you see are past data or historical data. In other words, the markets are not random, the future repeats the past based on certain intervals of time which I discovered. The dates on the charts are future dates where I expect highs and lows occur in terms of time. This does not tell you how far a market will move. It may move 10 pips, or 300 pips, that I don't know. I just know how to time market price moves.


you must incorporate ATR into your Algos ?
 
Top