Hi folks,
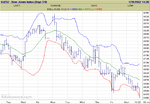
I am trying to see if there is a 1,2,3,4,5 pattern in the daily chart of the Dow from the most recent low to the most recent high.
From the sketchy knowledge I have of the subject it doesn't seem to conform which either means we haven't finished this uptrend yet or I need to study more.
Is there anyone who could elaborate on this theory and discuss whether we are still at wave 3, correcting to wave 4 or are on the way back down from the top ?
😕
Just interested to see the theory working in practice. I find it v. hard to see the turning points in the indices, better in the commodities.
🙂

