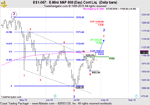
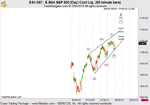
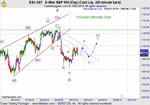
The ON session tested 1127.75 and failed. The June high was 1129.5 on the continuous contract. Jobless claims jumped by 2,000 and the market sold off. I'm looking for confirmation that a top is in place... meaning 5 waves down, followed by a 3 wave counter trend rally. Traders may want to consider short positions should this occur.
Best of Trading
The market finished the week on another low volume affair. When we last spoke, I was looking for conformation that a tradable top was in place. The trade never materialized. Corrective waves are always tricky because the pattern(s) and count can be complex in nature. Often, the pattern and count isn't identifiable until the wave structure has completed. Identifying the wave structure from the low of 1006 has been challenging. So stepping back, let's look at the big picture and work or way down to the daily level.
A Head & Shoulder Top?
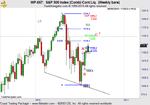
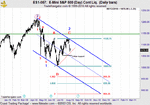
The first chart is the weekly continuous combined contract for the S&P. I have identified a possible H& S pattern. The right shoulder (RS) appears to be building in a 3 wave structure. Notice that 1146 is resistance where Wave A = Wave C. This resistance is also chart resistance from the high of the Left Shoulder.
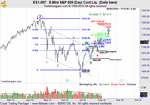
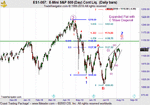
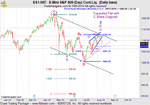
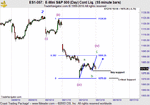
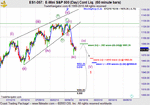
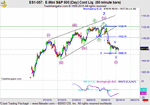
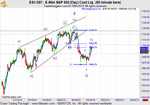
Turning our attention to the daily chart level, I am currently working two scenarios ( a double 3: W-X-Y) and ( an expanding flat with a wave C diagonal) for the current advance. Here's the charts for both for everyone to review.
What's important to know is that it doesn't matter which way you label the chart at this point. Both interpretations have the same implications when completed and offer similar targets for the termination of wave 2 (blue).
Targets For Wave 2 Termination
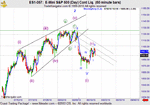
The key EW resistance levels to watch for next week are: 1136, 1143-1149.25. 1152.85 - 1156.25. I will post the wave C diagonal fibonacci clusters before the market opens on Monday. Together, they should give us areas of confluence that coincide with the larger time frame analysis.
Where Are We Wrong?
On the daily chart level, a break below the lower trend line and a break of key support of 1084.5 would mean that the current wave labeling was incorrect. A break of 1053 would most likely mean that wave 2 (blue) had ended.
Best of Trading

