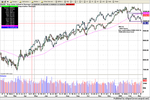
DOW THEORY gives SELL signal!

bgold

Established member
Messages
532
Likes
5
Yesterdays' new INDU closing low below 10470 confirming the new lows on TRAN on back of high volume was a classic DOW Theory sell signal.

Bears can come out of hibernation and Bulls would probably be best advised to reduce leveraged exposure. The computer programs which kicked in last night are certainly based on believe that this only beginning of a new trend.

While the Theory is certainly not infallible, it cannot be brushed aside. Primary traned tend to last months (if not years) and usually mean moves of at least 20% (we are now down only about 5%).

Last years BUY signal was certainly a good one at INDU at ~8000.
 

Attachments

  • dowtheory11march04.png
    dowtheory11march04.png
    122.2 KB · Views: 817
Aren't there a lot of dow jones sector indices,B? Which should you look to for confirmation.Always Tran?
 
Classical Dow Theory always looked for confirmation between Industrials and transport. Both confirmation signals and divergance signals are important.

If you follow classical Dow Theory!

BGold is correct in that these cannot be ignored because theirs no telling how many trading Bots are programmed to follow or fade these signals.
 
Originally the railroads - the high tech stocks of the day - made up the lion's share of the Dow Transports.

There's a strong argument nowadays to look to the Nasdaq for confirmation of a Dow Theory signal on the Industrials.

beartrap
 
In a nutshell, Dow Theory basic principles are:

1 the Averages discount everything
2 There are 3 trends in the market: Primary (or Major) Trend is the long term trend in price of stocks, which lasts from one to several years, and its discovery and confirmation is the main purpose of Dow Theory, Secondary reaction is corrective in nature, interrupting and moving in opposite direction of Primary Trend, (and Minor trands are day-to-day fluctuations). Also know as Tide, Wave and Ripple.
3. Primary Uptrends go through 3 above mentioned phases (bit similar to elliott wave 5 waves)
4. Primary Down trends idem in bear markets
5. THE TWO averages (industrials and Transports) MUST confirm each other. To signal a bear trend , both DJIA and Transportation Average must drop below the lows of their respective previous secondary levels. (Bull signal reverse)
NB. DT does not stipulatre a time period beyond which a confirmation becomes invalid, but the closer in tiome the signals occur, the strtoinger the signal is perceived to be.
A Trend remains in EFFECT until a reversal has been signalled by both Averages!!
6. VOLUME MUST confirm the trend, and only CLOSING prices are considered.

Therefore, both in terms of both Averages confirming each other with relative closing lows as well as in terms of volume, there was a "classic" signal.

DOW theory is perhaps the eldest "western " TA methodology and was designed more to provide signals in terms business / economic activity. Fact is that it has served well to for 70+ years often providing important trend signals (but not always).

My personal views is that one cannot trade the DOW Theory without willingness to miss large chunks of primary trends and readyness to take massive drawdowns. But it certainly can be used to change bias from trading of the long versus short side.

At this stage, i think it's a signal that asset managers/investors at large will possibly reduce risk or at least be tempted not to increase long exposures thus at a minimum reducing upward momentum. Obviously it also coincides many other reversal signals, moving avareges etc, etc thus all reinforcing change in trend.

The fact that the DJIA confirmation comes just a month after Transports, might add to the importance of current signal.

I suspect that we'll know soon enough.
 
MERRILL LYNCH Comment this morning.

SHORT TERM BEARISH EQUITY REVERSALS ENHANCED: Wednesday's losses have significantly enhanced the perception that 03/04 global equity recovery moves have reached exhaustion. The 2 primary engines of the equity rallies, the Nasdaq Composite and Hang Seng have both indicated near term bullish failures that will favor additional losses well into Q2. We suspect that the Q1 highs will not be eclipsed until H2 2004. Additional losses of 5-7% should not be discounted. ACCELERATED EUROPEAN SELLING PRESSURES: Events in Europe this morning have triggered aggressive liquidation pressures in European equity markets. There have been a number of reports of possible asset allocation shifts from equities to fixed income. Again, this enhances the perception of bullish trend fatigue, and lower prices into April.
 
Even CNBC is referring to Dow Theory SELL signal! Bear market bounce will therefore probably be quite hefty???
 
Was that a Dow Theory sell signal?
Just to complicate matters, Richard Russell thinks so but others claim there hasn't been a proper bounce of the lows to qualify:

If you want to learn more read the CBS marketwatch story on Dow theory signal:

http://cbs.marketwatch.com/news/story.asp?guid={F12D893A-486C-48EE-89BF-14E21467C236}&siteid=mktw&dist=nbs

Was that a Dow Theory sell signal? By Mark Hulbert, CBS.MarketWatch.com
Last Update: 12:01 AM ET Mar 12, 2004

ANNANDALE, Va. (CBS.MW) -- The stock market may have generated a Dow Theory sell signal this past Wednesday.

I use the word "may" because only one of the three Dow Theorists tracked by the Hulbert Financial Digest believes that such a sell signal was generated. The other two remain bullish.

How can such disagreement exist among devotees of this venerable market timing system, which arguably is the oldest of any of the major market timing systems in widespread use today?

Therein lies a tale.

Ambiguity exists because the Dow Theory's creator never codified it into a set of objective rules. It was introduced over a 30-year period at the beginning of the last century in editorials in the Wall Street Journal.

Those editorials were written by William Peter Hamilton, then the editor of that newspaper, on the basis of conversations he had with Charles Dow, the founder of Dow Jones & Co., the newspaper's publisher.

Hamilton's editorials leave lots of room for followers to argue over the more esoteric points of the theory.

To be sure, there is broad agreement on its general outlines. If both the Dow Jones Industrials Average ($INDU) and the Dow Jones Transportation Average ($TRAN) jointly reach significant new highs, the stock market is likely to continue rising. Similarly, the market is likely to continue falling if both averages jointly reach significant new lows.

At a conceptual level, many Dow Theorists also agree on the three prerequisites for what it takes to signal a change in the market's trend. Consider what those three steps must be when the trend changes from bullish to bearish:

Step No. 1: Both Dow Averages must undergo a significant correction from joint new highs.
Step No. 2: In their subsequent rally attempt following that correction, either one or both of the Averages fail to rise above their pre-correction highs.
Step No. 3: Both Averages must then drop below their respective correction lows.
Richard Russell, editor of Dow Theory Letters, thinks the last of these three pieces fell into place on Wednesday.

Here's his rationale. From their January highs (set on Jan. 26 for the DJIA and Jan. 22 for the DJTA), both averages suffered a correction that lasted until Feb. 4, when the DJIA closed at 10,470.74 and the DJTA closed at 2,822.11. That fulfilled Step No. 1.

Step No. 2 was satisfied by the rally that began from those Feb. 4 lows, since in that rally only the DJIA rose above its January high. The DJTA did not.

Then, this past Tuesday, the DJIA closed below its Feb. 4 low, followed on Wednesday by the DJTA. That was Step No. 3.

Based on this, Russell believes that the market rally that began in October 2002 is now over.

Russell's track record makes it hard to disagree with him. His market timing performance since 1980, when the Hulbert Financial Digest began tracking newsletters, places him at or near the top on a risk-adjusted basis.

The reason there is room for disagreement about Russell's interpretation is that Hamilton was not precise about how serious a correction is needed to satisfy Step No. 1. Not every correction will do, of course, since some corrections last only a couple of hours, while others last weeks or months.

Some other Dow Theorists believe that the late January/early February correction was neither long enough nor deep enough to qualify. For the DJIA, that correction lasted only 7 days and shed just 2.2 percent from the average's value. For the DJTA the correction was only marginally longer (9 days) and deeper (8.4 percent).

And if that correction doesn't qualify, then no sell signal was generated on Wednesday -- leaving intact the last signal that was generated by the Dow Theory.

Both of the other Dow Theorists the HFD tracks -- Richard Moroney of Dow Theory Forecasts, and Jack Schannep of TheDowTheory.com -- believe that this last signal was a buy signal. They therefore remain bullish.

So there you have it -- one Dow Theorist bearish, two bullish.

Why, oh why, couldn't Hamilton have been clearer?
 
Top