A simple but not easy question

mythseason

Junior member
Messages
24
Likes
0
What is trend? And how to define it, I search on the net and find all definitions are saying "General Direction", "Tendency", but what is general direction? What is tendency? Without defining those terms, how to defin trend?
Please elaborate your idea.
:clap:
 
Look at your chart.
If the wiggly line is lower than when it started you're in a downtrend
If the wiggly line is higher than when it started you're in a uptrend
 
  • Like
Reactions: BSD
What is trend? And how to define it, I search on the net and find all definitions are saying "General Direction", "Tendency", but what is general direction? What is tendency? Without defining those terms, how to defin trend?
Please elaborate your idea.
:clap:

Forget definitions. Look at the chart and ask yourself what is the direction of the trend of the time scale that you are trading. That is the way that you want to go. It comes down to opinion and your money, in the end.

Split
 
Yes, that's basically it.

But its not a silly question because your trend could be diferent to my trend depending on the timescale we are planning to take a position for. I might be planning a position to last a week, whereas you could be looking at 3 hours on one of those days - your day's trend could be opposite of the week's trend,m but we both still make money.

Confirmation of the trend comes from using moving averages, rising swing lows or falling swing highs, and there are some indicators that will offer confirmation. The right choices depend on what you are trying to do.
 
No, I was not suggesting that it was a silly question, but I do believe an eye-ball look at a chart gives a better idea of direction than set rules.

The only rule that I can think of, right now, is the importance of choosing a trend within the time frame that you are working.
 
Actually, setting rules is very important to me because I am a program trader.
The fact that I am asking this question is, does the difference between two points on the chart represents the trend?
Do I need to take care of time frame? Which means, do I just need to care about the price or need to do with time?
 
Yes, that's basically it.

But its not a silly question because your trend could be diferent to my trend depending on the timescale we are planning to take a position for. I might be planning a position to last a week, whereas you could be looking at 3 hours on one of those days - your day's trend could be opposite of the week's trend,m but we both still make money.

Confirmation of the trend comes from using moving averages, rising swing lows or falling swing highs, and there are some indicators that will offer confirmation. The right choices depend on what you are trying to do.

MA is always be used as an indicator of trend, but if you dig into the definition of MA, you will find that, when golden cross appears, only means the price has raised up to a certain level before, when death cross appears, only means the price has fallen down to a certain level before. Which basically, the difference between two points on the chart although the difference varies accross time, but by definition, it is JUST the difference between two points. Do you guys agree that it represents the trend only by two points?
 
Actually, setting rules is very important to me because I am a program trader.
The fact that I am asking this question is, does the difference between two points on the chart represents the trend?
Do I need to take care of time frame? Which means, do I just need to care about the price or need to do with time?

The time trame is of extreme importance. Take a look at the Footsie daily chart. This has been in a downtrend for months. A short position trader has had no problems with the trend during that time, has he? Except for one area of consolidation which may have given him some food for thought.

However, for intraday traders, there has been a variety of trends in that time. What is your opinion of trends with regard to stop losses, by the way, for programme trading? A steeply falling trendline does not appeal to me as much as a horizontal line does. The more horizontal the line, the more clear cut it seems to me.

Initially I thought of how to eliminate the effect of time in trading since I don't really need to know the time frame, which others do. People looking into 1 min/5 min/30 min/daily candle sticks to determine their trading decision. I don't want to act this like that. My programme will long at raise and short at fall, the rule is so simple, that's why I am so concern about the determination of trends. BTW, I am an intraday HK HSI trader.
 
What is trend? And how to define it, I search on the net and find all definitions are saying "General Direction", "Tendency", but what is general direction? What is tendency? Without defining those terms, how to defin trend?
Please elaborate your idea.
:clap:

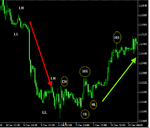
A time frame is trending when a succession of obvious higher swing highs (HH) and higher swing lows (HL) results in an uptrend, with the opposing lower swing highs (LH) and lower swing lows (LL) occurring in a downtrend. (see pic 1)

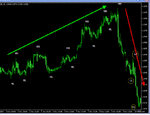
A trend on any time frame is said to be in question when, continuing with a downtrend example, the last LL then last LH of the downtrend is exceeded to the upside, from an area of support, directly or following an HL from it’s lowest point.

This is shown in the example ; a downtrend of lower highs and lower lows was in place on this time frame, until an equal high (EqH) to it’s last LH from support found at it’s lowest point was then succeeded to a HH following a HL indicating that the down trend on this time frame could be at an end for now. Indeed a 2nd Higher Low (HL) resulted in a second Higher High, (HH.) establishing then a new uptrend (see pic 2)

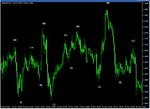
Pic 3:
In the further example below, this time an uptrend composed of classic HH’s and HL’s was quickly reversed by a Lower low (LL) than the last HH and HL of the uptrend before a further Lower High (LH) and Lower Low (LL) occurred, establishing then a new down trend. Using the example , When the last HH and HL an uptrend is exceeded to the downside, it puts into question the prevailing uptrend on that time frame, and may indicate the beginning of a new opposing trend, or indeed a period of consolidation. The opposite holds true for a downtrend.

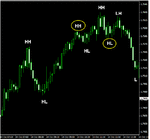
Looking now at when a time frame is ranging/consolidating. The chart below shows a random distribution of HL, HH, LL and LH as price consolidated and remained undecided about it’s next direction. (see pic 4.)
 

Attachments

  • pic 1.gif
    pic 1.gif
    16.8 KB · Views: 264
  • pic 2.gif
    pic 2.gif
    14.4 KB · Views: 267
  • pic 3.gif
    pic 3.gif
    22.7 KB · Views: 257
  • pic 4.gif
    pic 4.gif
    20.7 KB · Views: 274
Last edited:
The minimum requirement in establishing a trend may be present/developing is either;

a. the break of a range/price consolidation area (pic a)

or

b. Using an uptrend example; the last HH and HL of the trend is breeched to the downside, possibly after a LH, as in the screenshot example below; (pic b)


With potential SBR/Resistance now at the breeched HL, on pullback re-test of the area

In the event of a downtrend the last LL and LH of the trend will be breeched to the upside possibly following a HL with potential RBS/Support now at the breeched HL, on any pullback re-test of the area,
 

Attachments

  • pic a.gif
    pic a.gif
    11.5 KB · Views: 256
  • pic b.gif
    pic b.gif
    15.2 KB · Views: 269
"MA is always be used as an indicator of trend, but if you dig into the definition of MA, you will find that, when golden cross appears, only means the price has raised up to a certain level before, when death cross appears, only means the price has fallen down to a certain level before. Which basically, the difference between two points on the chart although the difference varies accross time, but by definition, it is JUST the difference between two points. Do you guys agree that it represents the trend only by two points?"

No. Who said anything about crosses? Yes, certainly you would be right if you use the slope between two points (golden cross and dead cross) as the way to identify the trend, but that is not recommended; do not use the occurrence of crosses to identify trend direction.
 
I did not understand that part.

What kind of chart do you look at? How many trades do you make in a day?

I am looking at tick by tick chart and about 4 trades a day on average, the trend I am looking for intradaily is large trend. Large enough to cover all my stop loses
 
A time frame is trending when a succession of obvious higher swing highs (HH) and higher swing lows (HL) results in an uptrend, with the opposing lower swing highs (LH) and lower swing lows (LL) occurring in a downtrend. (see pic 1)

A trend on any time frame is said to be in question when, continuing with a downtrend example, the last LL then last LH of the downtrend is exceeded to the upside, from an area of support, directly or following an HL from it’s lowest point.

This is shown in the example ; a downtrend of lower highs and lower lows was in place on this time frame, until an equal high (EqH) to it’s last LH from support found at it’s lowest point was then succeeded to a HH following a HL indicating that the down trend on this time frame could be at an end for now. Indeed a 2nd Higher Low (HL) resulted in a second Higher High, (HH.) establishing then a new uptrend (see pic 2)

Pic 3:
In the further example below, this time an uptrend composed of classic HH’s and HL’s was quickly reversed by a Lower low (LL) than the last HH and HL of the uptrend before a further Lower High (LH) and Lower Low (LL) occurred, establishing then a new down trend. Using the example , When the last HH and HL an uptrend is exceeded to the downside, it puts into question the prevailing uptrend on that time frame, and may indicate the beginning of a new opposing trend, or indeed a period of consolidation. The opposite holds true for a downtrend.

Looking now at when a time frame is ranging/consolidating. The chart below shows a random distribution of HL, HH, LL and LH as price consolidated and remained undecided about it’s next direction. (see pic 4.)

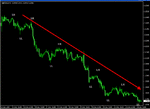
I was using the same thinking path as yours before, but later on I discovered trends not always come in LH and LL, in your pic1, from the first LH, it goes straight down, can I say this is a trend? Surely yes, but it doesn't come along with LH and LL, then without this, we cannot always identify trends.

This back to the original question, is TREND connected with TIME?
 
"MA is always be used as an indicator of trend, but if you dig into the definition of MA, you will find that, when golden cross appears, only means the price has raised up to a certain level before, when death cross appears, only means the price has fallen down to a certain level before. Which basically, the difference between two points on the chart although the difference varies accross time, but by definition, it is JUST the difference between two points. Do you guys agree that it represents the trend only by two points?"

No. Who said anything about crosses? Yes, certainly you would be right if you use the slope between two points (golden cross and dead cross) as the way to identify the trend, but that is not recommended; do not use the occurrence of crosses to identify trend direction.

OK, let's not talk about crosses. Think of a situation like this, we have 10 days MA, 50 days MA, and 200 days MA on the chart, and 10 is higher than 50 while 200 is the highest. Obviously, it is a "long term" downward trend, and a "short term" upward trend.

From the definition of MA, you found that it simply means the recent price is lower than a certain price of the 200 day cycle and higher then that of 10 days cycle and 50 days cycle. Which only gives me nothing more than the statement above? Back to the same question, do you think that only difference between two points represents the trend?
 
<<OK, let's not talk about crosses. Think of a situation like this, we have 10 days MA, 50 days MA, and 200 days MA on the chart, and 10 is higher than 50 while 200 is the highest. Obviously, it is a "long term" downward trend, and a "short term" upward trend.

From the definition of MA, you found that it simply means the recent price is lower than a certain price of the 200 day cycle and higher then that of 10 days cycle and 50 days cycle. Which only gives me nothing more than the statement above? Back to the same question, do you think that only difference between two points represents the trend?>>

The location of the MAs does not define trend, it can only confirm it. Price is the key factor in identifying a trend. If the price is rising you would not wish to short, regardless of where MAs are, and vice versa if price were falling.

Is this discussion pure techncial analysis theory, or do you actually have a trading / investment issue behind this?
 
Initially I thought of how to eliminate the effect of time in trading since I don't really need to know the time frame, which others do. People looking into 1 min/5 min/30 min/daily candle sticks to determine their trading decision. I don't want to act this like that. My programme will long at raise and short at fall, the rule is so simple, that's why I am so concern about the determination of trends. BTW, I am an intraday HK HSI trader.

Price does not generally move in an absolutely straight line over all timeframes. It it did then the basic equation that trend is represented by a difference in price at 2 points in time would work on all timeframes. However the market doesn't work like that - there are short term and longer term trends that can be completely opposite to each other (also consolidation and choppiness) . Any programme that does not recognise the reality of the market will fail.

So you need to look at ways in which your program can constantly adjust a longer term trend to reflect the effects of shorter term timeframes and to be able to be used in all timeframes.

One way to do this is to look at an indicator such as parabolic stop and reverse. Do as search on Google, but here is an introduction.

Parabolic SAR - Parabolic Stop and Reverse - Parabolic Arcs - Parabolic Trend Lines

The point about this indicator of trend is that it also examines the strength of a trend i.e. it is not merely assuming that trending price moves in a straight line.

Now you can see that in a rising trend the parabolic SAR falls below the price line and in a falling trend the parabolic SAR is above. You can use this line as some kind of basis for deriving stop loss.

However you could also look at other factors apart from trend within your program. For example you could combine it with some kind of analysis of how overbought or oversold the instrument is. Remember that no trend goes on forever so any programme based purely on trend to-date will fail at some point, if you also fail to predict the end of a trend or adjust it to take account of the increased risk and uncertainty at this point.

Charlton
 
Last edited:
i personally dont hink it is a simpe as this,

I come from the mindset that if i knew what the trend was then i would know where the market is going and thus be able to predict the future....

the market must have a trend established before we can say that the trend by whatever definition is up or down.

but that trend has been and potentially gone........

so how do you define a trend??? my simple answer is you cant, it is all hindsight......you will know after you bet and riding it...

I advise you to change your mindset. You are right, by the time you see the trend you have missed most of the profit. The real skill is in forecasting the trend :idea:
 
Top