Many beginning and intermediate level traders may benefit from learning a new approach to risk management which I intend to discuss in this article. There are two types of trader that this may apply to and the first, (Trader A), is the one who enters a trade with a stop set at a fixed distance away from their entry and it is always the same distance regardless of the market or instrument being traded. Trader A places a stop entirely based on a fixed monetary risk and when the amount of money that they have set aside for the trade has departed their account they close the trade.
The second trader, (Trader B), places a stop that can vary in distance from their entry and is based on “Technical” reasons as to why the trade is no longer valid. In both cases the traders use a fixed amount of money per pip or per point of price movement and can be anything from 50p to £100 or more depending on their account size.
This simplistic approach has problems in both cases. For Trader A there is no accounting for the volatility of the market. Markets rarely go straight up or straight down and they fluctuate along their path whether trending or range bound. As such if the volatility of the market is greater than the distance that Trader A has set their stop then there is a high probability that they will be stopped out before the market reaches their profit target.
Trader B has the problem that their losses can vary quite a lot because Technical stops can be large or small depending on the approach being used to determine that the trade is no longer valid.
Let’s look at an example of how this may happen:
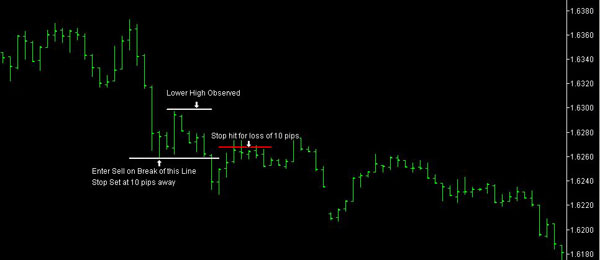
Trader A is looking to go Short and has just seen that the market has made a lower high so enters on the break of the most recent low setting a stop 10 pips away as can be seen in Image # 1. Unfortunately they get stopped out for a 10 pips loss as the market retraces slightly and then carries on down and would have made a nice profit.

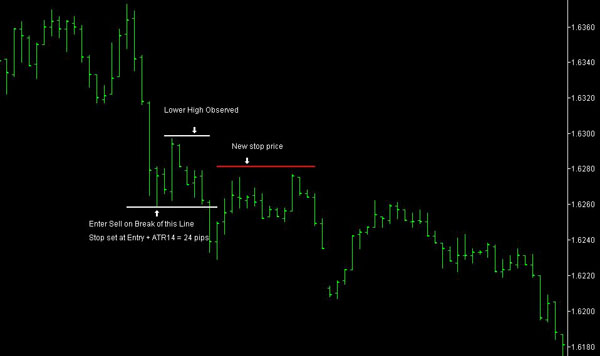
A better approach may have been to take into consideration the market volatility at the time of entering the trade. There are several ways in which this can be done and for the purposes of this example we will use “Average True Range” (ATR). This is an indicator that most charting packages have as standard and the favoured number of bars to measure it over is 14 so you will often see it stated as ATR(14). This can be changed to suit the average time that a trade is expected to last in numbers of bars but for our purposes ATR(14) is fine. We now see the same trade but with the ATR(14) at point of entry which in this case is 24 pips added to the entry price to become the stop level. This can be seen in image # 2 and in this case the stop level is not touched and the price then moves down to give a profit.

Please note that some traders prefer to multiply the ATR by an additional factor (often 1.5 or 2) and use that as the distance away from entry to set a stop. The idea being that at a distance of 1.5 x ATR or 2 x ATR away from entry price the trade is definitely no longer valid but for our purposes we will use 1 x ATR(14).
The above example is only half of the story because in this case Trader A would now be concerned that his stop is more than twice the distance than it used to be but before we move on to how this can be addressed let’s return to Trader B who places stops based on “Technical” reasons. Trader B is more likely to have variable losses because stop prices often vary considerably from where trade entry is taken. This may prevent Trader B from even considering good set ups if they think that the risk is too great. As such they can either miss out on good trading opportunities or have hugely different losses incurred when a trade fails. To address this issue both Trader A and Trader B could use different position sizing to reduce their losses based on where they wish to set their stop.
For example let’s look at a trading scenario for Trader A
Account Size = $50,000
Risk per trade = 1% = (0.01 x 50,000) = $500
ATR(14) = 24 pips
Position Size = Risk per trade / ATR(14) = 500 / 24 = $20.83 per pip of movement
We would round this down to $20 per pip and so if the market moves against the entry by 24 pips the loss is 24 x $20 = $480 (nearly the $500).
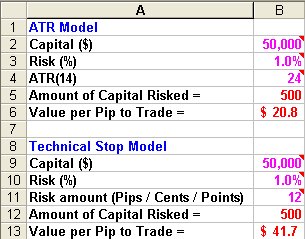
Trader B will set a Technical stop and all they need to know is what the difference in price is from their entry, for example it may 12 pips or cents away from entry. Both these scenarios are shown in an Excel spreadsheet as shown in image # 3 The spreadsheet can also be downloaded and used as the calculations are all automatic. Here is the link:
http://www.trade2win.com/media/knowledge/paul-mullen/Risk.xls

The above approach can be used for both intra-day and EOD trading as well but there is one more factor to consider in all of this and that is account size. Many new, intermediate and even advanced traders can have an account size that is too small for the risk that they wish to take. Often new traders ask about whether a $1000 account is large enough to trade with. This will depend on whether the broker being used will allow a small enough monetary value per pip / point / cent of movement to justify the risk. For example, if you have a $1000 account and wish to only risk 1% of that then that allows you to only risk $10 per trade. If the distance of the stop from entry is 24 pips then the amount per pip that you can risk is only 41c. The problem for many is that the broker may have a minimum amount that they will allow to be risked. If this is the case then you have three choices.
Hopefully this article has given those who have not considered an approach like this before some food for thought and comments are welcome.
The second trader, (Trader B), places a stop that can vary in distance from their entry and is based on “Technical” reasons as to why the trade is no longer valid. In both cases the traders use a fixed amount of money per pip or per point of price movement and can be anything from 50p to £100 or more depending on their account size.
This simplistic approach has problems in both cases. For Trader A there is no accounting for the volatility of the market. Markets rarely go straight up or straight down and they fluctuate along their path whether trending or range bound. As such if the volatility of the market is greater than the distance that Trader A has set their stop then there is a high probability that they will be stopped out before the market reaches their profit target.
Trader B has the problem that their losses can vary quite a lot because Technical stops can be large or small depending on the approach being used to determine that the trade is no longer valid.
Let’s look at an example of how this may happen:
Trader A is looking to go Short and has just seen that the market has made a lower high so enters on the break of the most recent low setting a stop 10 pips away as can be seen in Image # 1. Unfortunately they get stopped out for a 10 pips loss as the market retraces slightly and then carries on down and would have made a nice profit.

A better approach may have been to take into consideration the market volatility at the time of entering the trade. There are several ways in which this can be done and for the purposes of this example we will use “Average True Range” (ATR). This is an indicator that most charting packages have as standard and the favoured number of bars to measure it over is 14 so you will often see it stated as ATR(14). This can be changed to suit the average time that a trade is expected to last in numbers of bars but for our purposes ATR(14) is fine. We now see the same trade but with the ATR(14) at point of entry which in this case is 24 pips added to the entry price to become the stop level. This can be seen in image # 2 and in this case the stop level is not touched and the price then moves down to give a profit.

Please note that some traders prefer to multiply the ATR by an additional factor (often 1.5 or 2) and use that as the distance away from entry to set a stop. The idea being that at a distance of 1.5 x ATR or 2 x ATR away from entry price the trade is definitely no longer valid but for our purposes we will use 1 x ATR(14).
The above example is only half of the story because in this case Trader A would now be concerned that his stop is more than twice the distance than it used to be but before we move on to how this can be addressed let’s return to Trader B who places stops based on “Technical” reasons. Trader B is more likely to have variable losses because stop prices often vary considerably from where trade entry is taken. This may prevent Trader B from even considering good set ups if they think that the risk is too great. As such they can either miss out on good trading opportunities or have hugely different losses incurred when a trade fails. To address this issue both Trader A and Trader B could use different position sizing to reduce their losses based on where they wish to set their stop.
For example let’s look at a trading scenario for Trader A
Account Size = $50,000
Risk per trade = 1% = (0.01 x 50,000) = $500
ATR(14) = 24 pips
Position Size = Risk per trade / ATR(14) = 500 / 24 = $20.83 per pip of movement
We would round this down to $20 per pip and so if the market moves against the entry by 24 pips the loss is 24 x $20 = $480 (nearly the $500).
Trader B will set a Technical stop and all they need to know is what the difference in price is from their entry, for example it may 12 pips or cents away from entry. Both these scenarios are shown in an Excel spreadsheet as shown in image # 3 The spreadsheet can also be downloaded and used as the calculations are all automatic. Here is the link:
http://www.trade2win.com/media/knowledge/paul-mullen/Risk.xls

The above approach can be used for both intra-day and EOD trading as well but there is one more factor to consider in all of this and that is account size. Many new, intermediate and even advanced traders can have an account size that is too small for the risk that they wish to take. Often new traders ask about whether a $1000 account is large enough to trade with. This will depend on whether the broker being used will allow a small enough monetary value per pip / point / cent of movement to justify the risk. For example, if you have a $1000 account and wish to only risk 1% of that then that allows you to only risk $10 per trade. If the distance of the stop from entry is 24 pips then the amount per pip that you can risk is only 41c. The problem for many is that the broker may have a minimum amount that they will allow to be risked. If this is the case then you have three choices.
- Risk more than 1% of your account on any given trade
- Increase your capital to a level where more can be risked but keeps within the percentage you are comfortable risking
- Don’t take trades where the risk is above your comfort level
Hopefully this article has given those who have not considered an approach like this before some food for thought and comments are welcome.
Last edited by a moderator:
