Dow Jones EOD Analysis - Continuous

indrajit_16

Member
Messages
88
Likes
1
Folks,

Lets start a continuous thread on Dow (DJIA) analysis. The thread is dedicated on break-out techniques.

The rules:
We will analyse 3 trends of dow. One based on 20 days range break out, next 10 days range break out, and last 2 days range break out. Thus we can catch all short term trends. If we get a 10 day range breakout we will follow it with a 2 day range stoploss.

The technique is based on a complex Amibroker formula language (AFL) or a Metastock Formula (MS Formula) tweaked by me. It can be used in any liquid stocks and indices.

The dow EOD screen-shot attached:
dowscreenshot.jpg


The analysis is like this:
20 day swing is up trend with reversal at 7449
10 day swing is up trend with reversal at 7700
02 day swing is up trend with reversal at 7899

So, overall, dow shows uptrend. Please follow the reversal points.

Regards

Indrajit
StockManiacs - Free Analysis On Indian And US Stock Markets And Free Real Time Nifty Chart
 
Monday Morning Update 12th May 2009

Dow Jones is having strong resistance at 8600 level and support at 8135 level. Trade Triangle shows Dow Jones still in strong up-trend, if it can cross the resistance zone then it will have an upper target towards 9000 level. Trend reversal level and 5 DMA support exists at 8430 level. So far trade well and follow the trend, not the so-called experts.

Regards

Indrajit
StockManiacs - Analysis On Indian And US Stock Markets And Free Real Time Nifty Chart
 
technically the bb showing REVERSAL to down side

fundamental i think the news will decide ----Trade Balance & Treasury Budget
 

Attachments

  • us30cfd.GIF
    us30cfd.GIF
    13.9 KB · Views: 444
  • this week.GIF
    this week.GIF
    9.1 KB · Views: 339
Huge Resistance At 8600. Will Dow Be Able To Cross It?


Good analysis @ Hasanalali.

I have some excerpts from Collin Twigg's Diary: The Dow continues in an upward channel, headed for a test of 9000. Reversal below 7800 is unlikely at present — despite increased resistance signaled by large volumes at [R] — but would indicate that the rally has ended and a test of 6500 is to be expected. Expect strong resistance from profit-taking at 9000. Breakout above this level would offer a weak primary trend reversal signal, but prudent investors are likely to wait for the next correction. A secondary reaction that stops short of 6500, followed by a new high above 9000, would offer strong confirmation.

dowfeo.jpg


My additions: Dow (DJIA) is facing huge resistance around 8600 levels. Only a break-out above this level will confirm next up-move till 9000. Dow yesterday closed at 8419, marginally below its 5 DMA support level or 8427. Today's session may prove to be important for Dow, as any further closes below the 5 DMA level can warn of an intermediate trend reversal with an immediate target of 20 DMA at 8187.

Regards

Indrajit
StockManiacs - Analysis On Indian And US Stock Markets And Free Real Time Nifty Chart
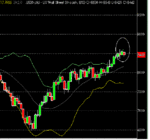

http://www.trade2win.com/boards/us-indices/49210-dow-2009-a.html

join this thread ....its been going for a while....
 
Good analysis @ Hasanalali.

I have some excerpts from Collin Twigg's Diary: The Dow continues in an upward channel, headed for a test of 9000. Reversal below 7800 is unlikely at present — despite increased resistance signaled by large volumes at [R] — but would indicate that the rally has ended and a test of 6500 is to be expected. Expect strong resistance from profit-taking at 9000. Breakout above this level would offer a weak primary trend reversal signal, but prudent investors are likely to wait for the next correction. A secondary reaction that stops short of 6500, followed by a new high above 9000, would offer strong confirmation.

dowfeo.jpg


My additions: Dow (DJIA) is facing huge resistance around 8600 levels. Only a break-out above this level will confirm next up-move till 9000. Dow yesterday closed at 8419, marginally below its 5 DMA support level or 8427. Today's session may prove to be important for Dow, as any further closes below the 5 DMA level can warn of an intermediate trend reversal with an immediate target of 20 DMA at 8187.

Regards

Indrajit
StockManiacs - Analysis On Indian And US Stock Markets And Free Real Time Nifty Chart

thaks dear(y) Indrajit
 
Wednesday morning update

Let us see graphical analysis of Dow Jones. In the attached image I tried to analyse the chart pattern of Dow in two different ways. Also its seen that current daily resistance for Dow is existing at 8639, whereas support exists at 8395 and Dow is exhibiting range bound narrow moves. Need to watch out for these upper and lower levels, as any break out will set a minimum target of 8950 and any break down will offer a target of 8200 or lower. So now trade possible inside the levels with positional plays only outside the range.

dowz.jpg


Regards

Indrajit
StockManiacs - Analysis On Indian And US Stock Markets And Free Real Time Nifty Chart
 
Dow Jones (DJIA) Broken Down Daily Support

In My last post on Dow Jones, I mentioned that Dow is trading in a channel between 8639-8395 and any break either side will set the mood for future. On Wednesday, Dow breaks through below its downward trendline support and closes at 8285. Dow also closes well below its 5 DMA at 8387 and 13 DMA at 8312. 5 DMA will now act for a major resistance for Dow in the coming sessions and to show strength in the near future Dow needs to close above 5 DMA resistance again.

Now where is Dow heading to? Dow already retraced 38.2% of its 21st April low and 7th May high and it is all set to retrace further 50% level of 8180 and 61.8% level of 8070. The 34 DMA for Dow is hovering around 8090 and 8100-8050 could act as major support for now. Daily RSI-2 is at 16.75, in strong bearish zone and creating negative divergences.

The present intermediate rally has started on the second week of March. But the rally was also not that strong to take Dow above its 200 DMA. Has the intermediate rally ended in Dow? Till now the answer is no. But if Dow breaks and closes below 8050 level for a couple of days, it will definitely signal the end of the current up-trend, and will confirm retest of 6500 or lower levels in the coming sessions. A falling ADX in the weekly charts suggests that the strengthless moves may stay for some more weeks, till we see a strong trend again.

Regards

Indrajit
StockManiacs - Analysis On Indian And US Stock Markets And Free Real Time Nifty Chart
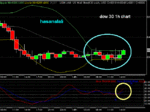
 
On the Thursday trading session, Dow moved in a very narrow range, respected the 5 DMA resistance at 8373 on the upside and finally closed at 8331 marginally up from the previous close. Candle patters suggests its almost an inside day in DJIA on Thursday.

dow.jpg


I attached a Dow weekly chart with this post and it suggests that Dow is resting and consolidating on strong trendline supports of 8214 and 8060. So far these supports are intact on weekly closing basis, the upward rally remains intact with a target of 200 DMA. The 200 DMA is at present hovering around 8917. Other supports for Dow now exists at 8240 (20 DMA) and 8105 (34 DMA). Daily RSI-2 is at 38.49, improved a bit but still not out of the strong bearish zone. Daily momentum indicators are signalling downwards, but weekly indicators moving up. It can be a rangebound show for Dow for some time before it gets a clear trend again.

Indrajit
StockManiacs - Analysis On Indian And US Stock Markets And Free Real Time Nifty Chart
 
Dow Weekly Update

Trade Triangle Analysis confirms that a short term counter trend move is underway. When this action is over, look for the longer term positive trend to resume. The uptrend with money management stops. Based on a pre-defined weighted trend formula for chart analysis, (Dow Jones) DJIA scored +85 on a scale from -100 (strong downtrend) to +100 (strong uptrend):

↑ +10 Last Hour Close Above 5 hour Moving Average
↓ -15 New 3 Day Low on last Friday
↑ +20 Last Price Above 20 Day Moving Average
↑ +25 New 3 Week High, Week Ending May 9th
↑ +30 New 3 Month High in May
-------------------------------------------------------
↑ +85 Total score for Dow (Up-trend).

Regards

Indrajit
StockManiacs - Analysis On Indian And US Stock Markets And Free Real Time Nifty Chart
 
Dow Jones Looks All Set For 9175 - Monday Night Update

Refer to my Friday's post on Dow Jones, where I have told about Dow resting on strong weekly support. Dow respected the support on Monday and bounced back 245 points on Monday and closed finally at 8504. Now where is it heading to now? We know a picture is equal to 1000 words. So let us analyse it pictorically.

dow.jpg


Dow already retraced more than 61.8% of the 6th January 2009 high and 9th March 2009 low. Dow is respecting its major supports and now it looks like Dow is all set to head towards the 100% retracement level at 9175. Before that, it may face strong resistance at 200 DMA level now hovering around 8906.Supports for Dow exists at 8240 level and immediate resistance exists between 8615-8625 level. Long positions can trail the longs with closing stop loss below 8240. DJIA now needs to conquer the immediate resistance level to head upwards. Watch out for the levels closely for the move (y). Cheers!!

Regards

Indrajit
StockManiacs - Analysis On Indian And US Stock Markets And Free Real Time Nifty Chart
 
Last edited:
Wednesday Morning Update Of Dow Jones (DJIA)

The U.S. stock indexes closed mixed on Tuesday after solid gains posted on Monday. Dow closed at 8475 down marginally by 29 points Bulls still have some fresh upside near-term technical momentum. Bears are anticipating the "sell in May and go away" phenomenon that has occurred in the past. However, the recent rally in stocks has surprised most with its resilience. Too many analysts expecting a downturn has actually prolonged the rally.

Dow Pivot Levels For Wednesday 20th May:

R3 - 8595
R2 - 8567
R1 - 8521
Pivot - 8492
S1 - 8446
S2 - 8418
S3 - 8372

Dow technicals quickly: 5 DMA support now exists at 8420. Immediate trendline support comes at 8237 and trendline resistance comes at 8608. Daily RSI-2 is at 68 in sell mode but still in strong bullish zone. So far Dow is in consolidating mood after the big gain on Monday.

Regards

Indrajit
StockManiacs - Analysis On Indian And US Stock Markets And Free Real Time Nifty Chart
 
Wednesday Night Update Of Dow Jones (DJIA)

The U.S. stock indices closed weaker on Wednesday. First higher and then finishing at their lowest levels of the day, Dow underperformed other US indices, closed down 0.6%. Turning, the corner at the mid-way of the week, the results shows that Dow is up 1.9% at week-on week basis. An old saying says 'Sell in May and go away'. Does that still hold true in these unusual times? This is now the big :?:.


Dow Pivot Levels For Thursday 21st May:
R3 - 8727.50
R2 - 8659.70
R1 - 8541.10
Pivot - 8473.30
S1 - 8354.70
S2 - 8286.90
S3 - 8168.30

Dow Quick Technicals: 5 DMA support now exists at 8421. Dow is now resting on exactly the 5 DMA and the move in either side of this crucial level will set the mood for Thursday. Immediate trendline support comes at 8245 and trendline resistance comes at 8602. Daily RSI-2 is at 43.45 in sell mode but currently in neutral zone. Overall, any prolonged trading activity now below 5 DMA can signal immediate retest of the trendline support at 8245.

Regards

Indrajit
StockManiacs - Analysis On Indian And US Stock Markets And Free Real Time Nifty Chart
 
Top