The Best Trading Opportunities At The Moment

Client

Member
Messages
64
Likes
1
In this thread I want to share my observations and technical analysis of stock charts. There are thousands of stocks and other securities which can bring profit if spotted in time. Feel free to comment my posts and suggest your own opinions.
At the starting point I would like to show you some of my forecasts regarding Dow Jones Index. As you may know, few weeks ago a significant support line was broken and the index went down. Will it continue falling or rise again? The chart below that I made few two days ago shows you my point of view.

dji-daily.gif

Read the rest of my analysis in the article about the Dow Jones index trading.
 
In this thread I want to share my observations and technical analysis of stock charts. There are thousands of stocks and other securities which can bring profit if spotted in time. Feel free to comment my posts and suggest your own opinions.
At the starting point I would like to show you some of my forecasts regarding Dow Jones Index. As you may know, few weeks ago a significant support line was broken and the index went down. Will it continue falling or rise again? The chart below that I made few two days ago shows you my point of view.

Read the rest of my analysis in the article about the Dow Jones index trading.

How are you coming up with the uptrend line? On my chart it looks like the line would be placed higher up, to be in line with the 50d MA (while it was trending). I am curious, thanks.
 
How are you coming up with the uptrend line? On my chart it looks like the line would be placed higher up, to be in line with the 50d MA (while it was trending). I am curious, thanks.
Speaking about DJI, there are 2 possible uptrend lines. One of them you can see on my weekly chart. It's the major one. The second one is based on the bottoms of smaller level starting from 2009.08.18, then 2009.09.02 and so on (there are 4 of them). You can't see them on my charts and I forgot to mention this moment. But both of these trendlines can be significant, the one I drew on my charts is just the first one (the nearest).
 
Another stock to consider - CRAY (Cray Inc.)
The bottom was reached about a month ago and then 2 bullish candlestick patterns occurred - 3 inside up and Highwave. It looks like there is going to be at least a correction but a new upside trend is also highly possible. See the weekly chart below.

cray-weekly.gif

Further analysis you can read in our review called Will CRAY Break The Channel?
 
Grupo Aeroportuario Del Sure (ASR ticker) definitely has a trading potential. I think it's not the time to trade it right now but keep watching it. Let me explain why:
This time we can clearly see an impulse wave that consists of 5 smaller waves. And as you may know, the first impulse can't be the last one. I mean that further bigger downward movement will continue soon after this correction is over.
Tower Bottom and Hammer models as well as the gap (window) form support for possible price fall. It is still unclear when this upside rollback will end but ASR may go to $53 point (Fibo 61.8%) or even reach the nearest resistance level.

asr-daily.gif
Further ASR technical analysis
Find more CFDs with the best trading opportunities on our CFD Dealing website
 
EUR/USD Looks Like Moving Up Soon.
Unlike cfds, currencies may seem to be more profitable but at the same time they are much more risky. That is why a thorough preparation is needed. Lets take a look at the chart below:

eur-usd-weekly.gif

Weekly bars came closely to the level of 61,8% Fibo but couldn't pass it over. Bulls are in command now. But before trading we should wait for confirmation which should occur in the form of a green bar moving higher from the previous bottom.
Lets lok now at the H4 chart:

eur-usd-h4.gif

The whole movement seems to be like the rounded bottom which is a bullish long term pattern. Besides that you can see a double bottom formed several days ago.

Read full EUR/USD technical analysis
 
Expedia Inc (EXPE)
Additionally, Rising 3 methods pattern was formed on the daily chart. This is a continuation pattern which tells us now that the price may go up further. But the question is "How high?". Most probably, this whole upside rally is a correction of the previous steep downside movement and it looks like a zigzag. As you can see on the daily chart, the first wave of that zigzag started about 2 weeks ago from $20.2 and ended at $23. The third and the last wave started at $22. According to the Elliott Wave Principle, these waves are equal in most cases that is why we should wait the price at the point $24.8.
Apart from that, this level is a 61.8% Fibo and a rather significant resistance level overall.

expe-daily.gif

Arguments for upside movement:
- the price couldn’t break the support line and rolled back on the weekly chart;
- High Wave and Tower Bottom patterns on the weekly chart;
- the price is beyond MA (34) on the daily chart;
- 3 Rising Methods pattern on the daily chart;
- presumably, this upside correction will reach 61.8% Fibonacci level.

Arguments for downside movement:
- the price is still below MA (34) on the weekly chart;
- steep previous downside movement signalise that bears are in command and the price may fall down soon.

Read full analysis of Expedia Inc (EXPE) and other CFDs.
 
Alcoa Inc (AA) which is listed in the Dow Jones index is currently in a triangle pattern which you can see on the daily chart. Triangle is considered to be a continuation pattern according to various technical analysis theories.

aa-daily.gif

Thus, we can wait for a proper moment to trade this stock. Read further to know why. Alcoa Inc analysis
 
This time we should pay attention to Cherokee Inc (CHKE). On the weekly chart a double bottom pattern was formed together with several bullish candlestick patterns: 3 Inside Up, Hammer and Tweezer Bottom (not marked on the weekly chart below).

chke-weekly.gif

The daily chart shows us the previous 5-wave impulse wave that ended in December 2009. Now the price is in corrective movement and most probably will reach the resistance level at $19.5. We should also take to attention the length of the previous rally in February that started from about $15.8 and reached $18.4. This gives us approximate target of the next upward movement - $19.6.

chke-daily.gif
 
The price of Impax Laboratories Inc (IPXL) increased by more than 3 times from April 2009 to March 2010 that you can see on the chart below.
Now IPXL hit the trendline and formed a Hanging Man pattern. These circumstances give us signals that this is a possible reversal point. Most probably, the price will retrace to the support level at $15.

ipxl-weekly.gif

The daily chart below reveals a Bearish Engulfing pattern near the trendline and one of the possible wave counts which admits that the major third wave is finished now and we should wait for a correction to the support line mentioned before.

ipxl-daily.gif

Arguments for downside movement:
- the price reached the upper trendline;
- Hanging Man on the weekly chart;
- Bearish Engulfing on the daily chart;
- the end of the third major wave according to one of the possible wave counts.

Arguments for upside movement:
- the price is above MA (34);
- bulls were strong during the previous 2 weeks and now continuation of the rally is possible after passing beyond the resistance level.
 
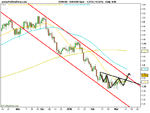
EUR/USD - well, well.....what do we have hear? IHS and a possibility of a break out ???

p.s. good thread, well done
 

Attachments

  • EUR_USD Spot.png
    EUR_USD Spot.png
    14.5 KB · Views: 281
The weekly chart of St. Joe Co (JOE) shows us the upside price movement, presumably, in the form of a complex correction W-X-Y according to the Elliott Wave Principle. The W-part is presented by a Zigzag pattern which is followed by the symmetrical triangle (X-part) and now we can expect that JOE will reach new highs after breaking the upper line of the triangle (Y-part).

joe-weekly.gif

On the daily chart below you can see the most probable scenario for the next few weeks. The price couldn’t pass over the lower trendline of the triangle and now is going higher.

joe-daily.gif

Arguments for upside movement:

* the end of the Triangle pattern on the weekly chart which is usually followed by a rapid breakthrough;
* the price couldn’t pass over the support level on the daily chart;
* Symmetrical Triangle is known as a continuation pattern.


Arguments for downside movement:

* the price is below MA (34);
* Triangles often serve as a last part of a complex correction.
 
Once again the price of DTS Inc (DTSI) tested the resistance level at $35.86 shown on the weekly chart below. The last few rising bars were supported by low trading volumes pointing to a possible reversion.

dtsi-weekly.gif

Weekly chart

2 bearish candlestick patterns were formed on the daily chart near the top, such as High Wave and Last Engulfing Top. Another reversal signal is the number of rising bars 9according to the Candlestick theory. There were no significant correction for a few weeks that means that the trend becomes exhausted (overbought).
It is not clear if the new downtrend starts now but a rollback to $32.5 is very possible.
Another support level to consider is the middle of the previous long bullish bar - $34.2.

dtsi-daily.gif

Daily chart

Arguments for downside movement:

* the price reached an important resistance level;
* 2 bearish candlestick patterns at the top;
* 10 rising bars on the daily chart without any significant correction which means that the trend becomes exhausted (overbought);
* very quick upside movement during last month.


Arguments for upside movement:

* the price is above MA (34);
* third testing of the resistance level may cause breakthrough;
* previous upward movement demonstrated the power of the bulls which may be not over yet.
 
Last edited:
The downward correction of Pfizer Inc (PFE) stopped at the Moving Avarage (34) and developed a bullish Morning Star pattern. Now we can expect the price to move up to the level of approximately $19.5-$20.

pfe-weekly.gif

One of the most important bullish signals here is a breakthrough of the downward trendline on the daily chart. At the same time there is a 3 Inside Up candlestick pattern which increases the possibility of a bullish scenario. The first target is a $18.7 point. Another one is $20 point which was shown before on the weekly chart.

pfe-daily.gif

Arguments for upside movement:

* bullish morning star on the weekly chart;
* the price went above MA (34) on the weekly chart;
* bullish englulfing and 3 inside up on the daily chart;
* the price broke the downward trendline on the daily chart.


Arguments for downside movement:

* the price is still below MA (34) on the daily chart;
* the level at $17.70 (the middle of the long red bearish candle) is a significant resistance level which can stop upside movement.
 
This day we should pay attention to Microsoft, one of the most well-known tickers listed in Dow Jones index. The last 6 weeks the stock was in the upside movement and almost reached the previous top at $31.

msft-weekly.gif

Weekly chart of MSFT

Sellers didn't allow the price to go higher than the middle of the long bearish candle. A Shooting Star pattern with a long upper shadow appeared though hasn't been confirmed yet.

msft-daily.gif
Daily chart of MSFT​

The price couldn't break the resistance level at $30 that you can see on the daily chart above. Along with that 2 bearish candlestick patterns were formed: Shooting Star and Engulfing. Additionally, there is a possible zigzag pattern which represents the whole upside movement. It is marked by A-B-C and may be over at the moment. From now we can expect at least a correction down to the level of $29 but the major downward trend should also be considered.
Despite the fact that the price is above MA (34) and upward trend is currently developing, there are many bearish signals that tell us about a reversal.

Arguments for downside movement:

* shooting star on the weekly chart;
* the price couldn’t go higher than the middle of the long bearish candle on the weekly chart;
* shooting star and bearish engulfing on the daily chart;
* the price couldn’t break the resistance on the daily chart;
* possible A-B-C correction is over on the daily chart.


Arguments for upside movement:

* the price is above MA (34);
* upward trend is developing;
* shooting star is not confirmed yet on the weekly chart.
 
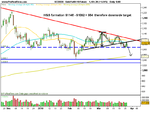
GOLD - H&S on daily ......down side target of 1040 triggered and active provided we stay below $1110
 

Attachments

  • Gold Full0410 Future-Gold.png
    Gold Full0410 Future-Gold.png
    14.9 KB · Views: 209
Edison International (EIX) is traded above the Moving Avarage (34) and about a mont ago we had a 3 Inside Up pattern on the weekly chart. The bar with the open price = the closing price strengthens the model.
Beside that EIX couldn't break the support level.

eix-weekly.gif

On the daily chart below you can see that the upward trend is supported by the lows at $32, $32.50 and $33.50. The last bullish models are Hammer and Morning Star. See the forecast below.

eix-daily.gif

Arguments for upside movement:

* The price is above MA (34);
* 3 Inside Up pattern on the weekly chart;
* Morning Star and Hammer patterns on the daily chart;
* The price couldn’t break support level on both weekly and daily charts.


Arguments for upside movement:

* the price could hardly reach new high after the 3 Inside Up pattern on the weekly chart;
* resistance at approximately $34.50 can stop the rally.
 
Top