thanks for the suggestion but never looked into how to work excel, know very little about computers. but if i cant find anything ill be drawing it onto graph paper which wont take long but will limit me to only an eod chart. is not uncommon for me to make hundreds of trades in a day so would be impracticle to record after every trade which would be ideal. not sure why something like this doesnt seem to be available. for any of you programmers out there this could be a very profitable project and not necessarily sold just to individuals, brokers are always looking for a bonus to offer their customers and this would be a nice little touch for a platform.
this must be possible and would be my perfect scenario:
3 boxes to be filled in:
1)which instrument ____ (typed here would be abbrev ie dow, eu etc)
2)amount risked____ (here the difference between entry and stop times stake cash or %)
3)return____
e.g.
d
100
0
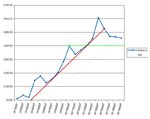
the programme could display an equity curve for all trades made, just trdaes for the dow, a chart for every trade or just eod. basically you could look at your performance every which way in graph form.
all this could be done manually but to have a programme that just allowed you to write d,100,0 and then a chart appeared in any way you chose in any time period since you started recording would be great. theres got to be thousands of people who would pay a few tenners for the convenience. maybe roi for people whod like that. if a broker picked this up it wouldnt even be necessary to type in anything since all trades are recorded as made

