This post is directed at any eSignal users who may be experiencing artificial gaps in their charts. It is problem I have noticed for some time, but was not sure of the reason, or indeed whether it was an eSignal issue or a problem with my setup.
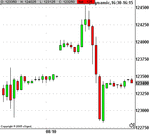
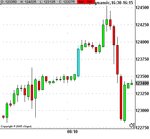
The problem is best illustrated with a couple of comparative charts (attached) from 10th August in symbol ES U5, Sep S&P emini:
These are based on a 57min chart (25 x 57 = 1425 mins), and a time template of 16:30 to 16:15 EST, the trading hours of ES. There is a big gap in one, which is as received from eSignal and on the second one I have corrected the bar by looking up the appropriate values.
On investigation it seems this is an eSignal issue related to their server time. They all run on PST, and the date changes at midnight PST, regardless of the timezone of your PC, or your chart template settings.
That is why I get a gap between the 02:57 and 03:54 57 minute bars (when my PC runs on EST), because the 02:57 bar cuts off at 03:00 EST (midnight PST) and the next bar only starts recording trades from 03:54 EST (00:54 PST) - in other words you miss the bit in the middle.
This also explains why the problem is worse the longer bar length you use - you end up missing more data! I gave up with 220 min Bunds because of this when my PC was on GMT/BST, although I did not know why there was a problem at the time.
The only work-arounds I know of so far will only work if the bar length you use is an exact divisor of the difference between your PC timezone and PST, AND an exact divisor of the difference between the start of your time template and midnight PST (in this example, PST - EST = 180 mins; 16:30 EST = 13:30 PST - midnight = 750 mins, therefore 30 minutes OK, 57 minutes not OK). The reason for this is the break between bars will coincide with midnight for 30, but will leave a gap with 57.
Sorry to be long-winded in my explanation, but this will potentially affect all eSignal users as far as I can see, depending what markets they follow, regardless of their individual settings as stated above. Obviously, markets trading long periods like forex (24 hours) and the S&P E-Mini (23.75 hours) are definitely affected.
I have spoken to eSignal support, who have acknowledged the problem, but it is way down their to-do list in terms of fixing it. I don't think this is acceptable when the charts are incorrect (missing data), and we customers are paying not insignificant money for a premium product.
I would encourage any other eSignal users affected by this problem to raise the issue with them so that they are aware it is an important issue from the customers point of view, and hopefully do something about it.
Intraxas


