The markets and those involved

wasp

Legendary member
Messages
5,107
Likes
880
This thread is to discuss trading and understanding what is going on inside every bar and those involved.

*If you disagree this is necessary or feel it is making things more complicated, or in any way a superior/ego based thread, simply ignore it. I will be ignoring those threads about setups*

I am in no way putting myself forward as a teacher and thus, anyone who wants to contribute about any aspect in relation, regardless of market, feel free.

I am away now till the market opens, enjoy your weekends..............
 
I'll play!

Okay, I watch GBP and EUR vs USD and JPY majoritively. No volume which is annnoying me in spot FX and so I use trends and support and resistance alone.

For me, getting in sync with the bank/hedge fund guys is paramount and by that I mean, I think they use 4hr and 1hr charts predominately so I try to use those too. I also believe Support and Resistance are the most important factors for smart money / strong hands (other than game playing) so that is all that features on my charts.

It is impossible to avoid news on the economy so I have that in my mind but that's as far as fundamentals go for me. Everything happens for a reason in my view so whether NFP or Interest rates, the direction to come can still be gauged easily enough so I trade through them.

I have a view of the monthlies on the markets related to me to get a view off the bigger picture, then drop to the 4hr to determine the most important S/R and then down again to the hourlies to fine tune my entries.

Whilst I partly agree with you that each tick tells a story, that alone is not enough as S/R is paramount and without it I would be blind. After that I am looking for action at said levels.

This is where understanding each candle is vital. You have to be aware of stop running, fake breaks, testing of the levels, the battle between buyers and sellers.... This comes with experience but it is the most important thing to watch and learn, also why I think, trading one market alone is a good idea so you get to know the players and their antics.

Just my 2c
 

Attachments

  • play.gif
    play.gif
    70.9 KB · Views: 900
Pointless post alert:

You use pink bars, too. Gay traders of the world, unite! :D (My border is a darker shade of red, though.)
 
I find it helpful trying to identify which side the big boys are on, which I still don't find easy.. A good starting point for me is to identify where we are in trend, and work from there... some days are good others are clear as mud.. :rolleyes: Hope this turns into a good thread...
 
I find it helpful trying to identify which side the big boys are on, which I still don't find easy.. A good starting point for me is to identify where we are in trend, and work from there... some days are good others are clear as mud.. :rolleyes: Hope this turns into a good thread...

When I look at a chart I work quickly from weeks days hours to 5 mins.....then if its a london open or wall st opening work down to mins......I dont really worry about who is doing what in what time frame as its all in the graph. I then look to see what would happen IMO if the price went down and if it went up. I am looking back to the recent past (most predictive...to days weeks ago for contributing factors (S&R).

Sometimes its easy, sometime its a dogs dinner. With the benefit of hindsite you can improve...it takes time though.
 
Pointless post alert:

You use pink bars, too. Gay traders of the world, unite! :D (My border is a darker shade of red, though.)

That's alright, I have a pink TV in my office! (It was my nieces old one before her room was decorated, honest!) ;)
 
I find it helpful trying to identify which side the big boys are on, which I still don't find easy.. A good starting point for me is to identify where we are in trend, and work from there... some days are good others are clear as mud.. :rolleyes: Hope this turns into a good thread...

Ahh yes, the 'big boys'... Something I have always had 2 minds about. Weak hands and strong hands........ I can understand from a large TF, the big boys bias say, on the GBP of late has been short. What gets me though is the short term.

Lets say price is sat at 200 on the GBPJPY. Its an important psych level, there is support there a couple of times prior and its the middle of the UK trading session. As far as I am aware, there is no 'tier 1' of traders who can guarantee they ca move such a liquid market so where some may say, a pinbar down to 199.60 was stop hunting and for catching weak hands into the shorts to provide more money, who is to say it was not say, HSBC traders really wanting to short but there is far too much interest in going long from RBS, and citibank and The Norinchukin bank and they push price back up to a previous Resistance level to get a better price to continue the short?

I am sure someone knows where this is from as I only read it in a post on these boards and think it came from a book.............

A broker is watching the market, he sees price at level X and tells his staff to sell 5000... The market absorbs it and pushes down then retraces immediately, so he puts in a nother 20'000 to convince more people to join in the shorts, once he saw they played ball, he, knowing their was too much interest in the rise of the market, then dumps the lot and goes long 50'000........

My point there being, is not everyone trying to gauge what everyone else is doing and where the larger bias is, and have little time, money or indeed confidence to just shake out the shorts/longs as they do not know for sure what is happening next. Obviously in the example, it was based on a particular stock and it was years ago and thus, the only competition/others were in the same floor exchange but nowadays, with the access to markets around the globe from so many avenues, this is no way near as easy to decipher?
 

Attachments

  • wot1.gif
    wot1.gif
    7.5 KB · Views: 560
Last edited:
That's alright, I have a pink TV in my office! (It was my nieces old one before her room was decorated, honest!) ;)

Ah, yes, I have a pink Sony MP3 player. It's my sister's old one before she upgraded to an iPod. It still has Take That and Kylie on it. So that's proof it's my sister's. Um... I think. I will remove their albums. Just have a little patience... Oops.
 
textbooks do work

I guess one can make it more difficult than required when it is really straightforward.

All this is obvious if one just had a price ticker, pencil and paper even... its just buyers vs sellers and seeing who wins and joining them IMO.
 

Attachments

  • simple.gif
    simple.gif
    26.6 KB · Views: 546
I guess one can make it more difficult than required when it is really straightforward.

All this is obvious if one just had a price ticker, pencil and paper even... its just buyers vs sellers and seeing who wins and joining them IMO.

You're making it look simpler than it is(*). For all the newbies reading this, I think it's important to realize that determining what constitutes a breakout, a reversal, a retracement, a test, a re-test, etc. is not always that straightforward in real time as it is in hindsight. One person's breakout might be another person's shake-out.

If one hasn't defined how to recognize all of these in real time, what to do when he sees them - and what to do when he doesn't see them - then the trader will most likely run into trouble when the market is open.

PS: I don't even know what a 'tweezer top' is...
(*) Of course it's that simple ;)!

This is where the months of screen time, watching and marking notes on the chart so you learn to be ready and see them.

As it goes though, I thought they were all quite obvious?! Maybe its just me?
 
This is where the months of screen time, watching and marking notes on the chart so you learn to be ready and see them.

As it goes though, I thought they were all quite obvious?! Maybe its just me?

Yes they look obvious because of the way you've marked the chart. But you are forgetting one thing: drawing lines, identifying breakouts and retests is probably second nature for you. But it's not for the person who looks at your chart for the first time and thinks "wow this is easy, I can do this too".

Attached is a chart where I'm playing devil's advocate. Comments numbered from 1 to 7, blue circles are reverse 'pinbars' (you can call them anything you like).
 

Attachments

  • comments.GIF
    comments.GIF
    38.8 KB · Views: 583
Yes they look obvious because of the way you've marked the chart. But you are forgetting one thing: drawing lines, identifying breakouts and retests is probably second nature for you. But it's not for the person who looks at your chart for the first time and thinks "wow this is easy, I can do this too".

Attached is a chart where I'm playing devil's advocate. Comments numbered from 1 to 7, blue circles are reverse 'pinbars' (you can call them anything you like).

Very good points FW, I'll not reply yet though, just in case anyone else wants too......
 
good way to learn price intra day is standard small box p&f chart, I use 5 pt on ftse, I started out with them and have gone back to them in the last few months

eye opening if you have never used them before and worth a look if you have trouble with your S & R levels and being faked in etc

You remember what happened at certain levels / you have a record etched in your head ready for later use / collection of evidence

I find they help anyway (don"t trade the patterns just use chart for range / location)

link to how to construct them and another with large box ones already done for you ~

Marc Rivalland.com

Investors Intelligence just click on any chart and 50 box one will appear you can mess with

Andy
 
a couple of points...

* whether this is of any relevance I don't know, but my chart looked pretty similar to yours Was...Sweepylongblahblahblahblah... I think this is probably due to a couple of things, including a) the hours spent studying the PA, b) we just happen to agree, coincidence, and c) good taste ;)

As for the comments FW makes on your chart, I make the following suggestions

* The "false breakouts" that are highlighted on your chart... clearly whether it is actually a false breakout or not will depend on one's defenition (close above / below, break of high / low etc...). I mention it because different definitions may equally return additional, profitable, opportunities than the losers in this case.

** Secondly, I think part of the issue is that a currency example has been used. On my charts, I mark out pivot points (as I call them; basically horizontal lines where price has turned, and I look for S-> R and vice versa). I do not expect price to react to my levels exactly - the traders driving the price, in the spot and forward markets, don't give a sh!t about what I've got on my chart. They are much more like "flags" to help me determine where abouts a reaction in price is likely to occur, and where abouts I might be able to focus in on the Price Action and pick out an oportunity...

*** With regard to the "pin-bars" highlighted, I follow on from my previous point. Trying to understand the nuances of every tick along the chart is a noble ideal indeed, but rather useless on it;s own. A much harder skill, one that cannot be taught, is how to determine which ticks / whatever are important, and which are not (perhaps they are all important for exactly this) - I use my "flags" to help me with this, others will have different approaches...

What I am trying to say is that, despite all the terminology, rules and definitions that exist (and, I hasten to add, are useful), a large part of successful trading is discretion. The discretion not to take a Pin bar in the middle of nowhere, the discretion to sell off a level that hasn't been fully tested, discretion not to take a break-out trade just because price has crossed my line by a pip. I suspect that is one of the many reasons new traders get frustrated... even though I have clearly defined criteria for taking a trade, I can't take discretion out of the mixer. And you can't teach it or write it down, you just have to practice until it comes.

If one has the skill, in the right market, it is possible to read Price action like a piece of music. The ability to identify general regions of price that are likely to cause a reaction, then watching the price in real time to guage the markets reaction to this region. When it all hooks up together, it seems possible to trade the evolving price action like "3 blind mice" on a recorder, but it sounds like something Mahler wrote. Much is said about discipline, strict entry criteria, trade management, and rightly so. The irony is that these skills, combined with a fair level of experience and discretion, can sometimes lead one to "take price as it comes" and "go with the flow", when all the instruments in your trading orchestra are reading off the same hymn sheet, in tune, and in time.

That is the hallmark of a skillfull trader IMO.

P.S. Apologies for all the mumbo - jumbo... the crux of my point is that you can't automate trading altogether. In all successful traders there is an element of skill and judgement in reading their market. It only comes after bucket loads of eye popping frustration, which is why so many fall before the final fence.
 
So so far we've learned:

1) Technical analysis works beautifully in hindsight.
2) Everyone utilises/applies it in different ways.

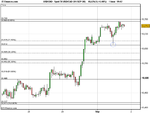
Not much you can do about 1), i've been wondering all evening why I didn't trade the pin circled in the attached chart.

I tell a lie, I KNOW why i didn't trade it - in the past few days i've had losers because I got in too soon and didn't let price actually test S/R. This pin didn't touch 10612, i didn't buy, i'm not currently 25 odd points in the green. In hindsight, what I don't know is why I didn't overcome my fear and take the trade.


Point 2) on the other hand can, has, and will be looked into. It's all well and good saying screen time gives you your edge, but I'm sure if i gave my 8 year old cousin screen time I'd find my account falling even more rapidly than it is at the moment (ok maybe not)!

Ideas/theories, whatever you want to call it, need to be chucked about and discussed. As a great man once said 'I wanna say something. I'm gonna put it out there; if you like it, you can take it, if you don't, send it right back'.

There are soooo many differing views on how the markets trade. I hope TwistedHedgehog decides to come back and post as I have nothing to lose (and probably a lot to gain) from listening to what he and posters like Wasp/Firewalker have to say. Similarly, I hope they would feel they have nothing to lose reading what a newb like myself has to say!

my 25c
 

Attachments

  • Spot_FX_USD_CAD_(01-SEP-08).png
    Spot_FX_USD_CAD_(01-SEP-08).png
    24.3 KB · Views: 330
i've been wondering all evening why I didn't trade the pin circled in the attached chart.

I tell a lie, I KNOW why i didn't trade it - in the past few days i've had losers because I got in too soon and didn't let price actually test S/R. This pin didn't touch 10612, i didn't buy, i'm not currently 25 odd points in the green. In hindsight, what I don't know is why I didn't overcome my fear and take the trade.

This is exactly what I mean (no offence MB!!)...

what would have been a perfectly good trade went missing because of 1 pip... a pip that, in the real money markets, no-one gives a sh!t about (things are complicated by the the different liquidity pools in FX and how SB prices are calculated, but that's a different matter. What's important is that accuracy to 1 pip is an illlusion)...

The 1.0612 level isn't important. This isn't a trade because price couldn't break through 1.0612... this is a trade because the Price Action shows that the market has re-traced a move upwards, which encouraged more buyers into the market, pushing price further upwards. It should be clear from the chart that when price moved back into the 1.0625 area, the market wouldn't let it sit there. The market isn't comfortable with prices there, it was rejected pretty convincingly. That is why there is a trade here, not because of the poxy 1.0612 level;

this is what I mean by discretion, and thinking on your feet. Take the positives from it, you had identified an area where a reaction on price was likely, and you were right. Of most importance is where price is going, not the one pip it couldn't reach.
 
This is exactly why i posted it :) who cares where my lines are or whether they get broken by a pin...in hindsight I shouldn't let that affect my judgement. Dismissing trades purely on a stupid rule i made up due to 2 losers stopped me using my discretion and trading the PA that was on the chart in front of me.

The 1.0612 level isn't important. This isn't a trade because price couldn't break through 1.0612... this is a trade because the Price Action shows that the market has re-traced a move upwards, which encouraged more buyers into the market, pushing price further upwards. It should be clear from the chart that when price moved back into the 1.0625 area, the market wouldn't let it sit there. The market isn't comfortable with prices there, it was rejected pretty convincingly. That is why there is a trade here, not because of the poxy 1.0612 level

Excellent para, made me look at it in a completely different way.
 
This is exactly why i posted it :) who cares where my lines are or whether they get broken by a pin...in hindsight I shouldn't let that affect my judgement. Dismissing trades purely on a stupid rule i made up due to 2 losers stopped me using my discretion and trading the PA that was on the chart in front of me.


Excellent para, made me look at it in a completely different way.

Great reply from MrG there and just as a quick thought before nodding off, you could try using a thicker line when drawing those levels and think of them as zones/areas rather than specific pip levels and of course, why its bouncing there will make you see a pip here or there is inconsequential.
 
Top