Trading Gold 2009

  • Thread starter Thread starter 2be
  • Start date Start date
  • Watchers Watchers 5

2be

Senior member
Messages
2,062
Likes
367
I would like to use this thread to write some of my own findings related to trading Gold and compare them with the perspective of other traders. I am not intersted in "predicting" the price moves or in getting calls without the background leading to the possible scenario.
Gold is an important commodity and as such it is an important market instrument traded for many reasons and in a great variety of ways. It is also an important indicator in itself in the economic cycles well explained by John Murphey in "IntermarketTechnical Analysis", a book which I highly recommend for a serious student of the market.
In the current economic climat it has taken the world leaders gathereed in Davos more then two days to come to the conclusion that they do not know and are not too sure what to do. In such an uncertain time Gold is likely to appreciate, so the fundamentals are pointing to buy gold. Technical analysis shall assis a prudent trader to buy it on pullbacks, and possibly sell it with some profit/s or build a position.
One of my current trading approach is to use H1TF and use M15 as a trigger TF. For the position trading I use Weekly, Daily and H4, the principle is similar, with the difference of holding the position with multiple entries over a longer period of time.
My trading style takes into account the principle of gearing between the different TFs, and I am of the opinion that TA and the fundamentals regarding gold should work well together. My overall bias is to buy gold or trade it by buying the dips and taking the profit on the intraday TFs (30 to 150 pips) depending on the mini cycles indicated by the smaller TFs. So buy on pulbacks and sell when the price is turning down on M15.
It is nothing new, and a simple approach that seems to be working.
Happy trading to all,
2be
 
Gold is at an interesting junction having reached 929.48 and retraced back from the support established in September and October last year. 928.60 is also a confluence zone for some fibs, and the possible EW structure would indicate that a 5th wave has been accomplished, or it is about too be accomplished. If so a retracement of some kind shall follow before the journey up is resumed. This comment has to be weighted alongside the market perception of gold being the most stable investment instrument, and is seen as the best "reserve currecy" atm, resulting in a great demand for gold.
Scenario 1 - there is a retracement, possible (*short and longs) trading apportunity based on momentum generated by the down and up moves with severe SL, and conservative profits, adhearing of an ABC type correction.
Scenario 2 - the price breaks above the current support zone in a powerful way, giving a clear signal to go long.
 

Attachments

  • gold 30-01-2009.gif
    gold 30-01-2009.gif
    45.9 KB · Views: 322
I'd favour Scenario 1,a retracement to around 875 or 840 but can not rule out a stab above 930 first.
 
I'd favour Scenario 1,a retracement to around 875 or 840 but can not rule out a stab above 930 first.
The price structure of the market is influenced by the expectation of the final capitulalion of equities on the Wall Street, and this uncertainty has produced some unusual price behavoiur between USD and Gold in the last few months, were USD and Gold gained. One has to be careful not to be cought on the wrong side. Gold eventually will go highier, but after this correction.
 

Attachments

  • gold 03-02-2009.gif
    gold 03-02-2009.gif
    57.9 KB · Views: 332
Chuckie:
I will try to explain why after this scenario has materialised, in the mean time gold can go wherever it likes.

2be: Gold do not always correlate to US equities. It can break the perceived correlation anytime it likes.
 
Chuckie:
I will try to explain why after this scenario has materialised, in the mean time gold can go wherever it likes.

2be: Gold do not always correlate to US equities. It can break the perceived correlation anytime it likes.

Good thread 2be. I think Gold deserves its annual thread.

Gold is a highly speculative instrument which rises with uncertainty. In these uncertain times it is only the true safe haeven imo.

I think the only solution to our debt bubble and credit crunch is inflation. Even then the debt burden will take years to write off by natural means.

I also feel long term view currencies will have to find new levels. West and US will have to devalue and the far East revalue their currencies. In the short term I reckon gold has only one path open to it and that's up.

I see no stability anywhere. This is all assuming there are no impending wars or military extensions of one kind or another.

Finally, on TA based on 4H charts I see gold bouncing off 900 levels and next level is 940. I think we had our pull back around 810s week or two ago. Was expecting more but it didn't materialise. Hence, forwards and onwards. Reach for the stars... 👍
 
The price structure of the market is influenced by the expectation of the final capitulalion of equities on the Wall Street, and this uncertainty has produced some unusual price behavoiur between USD and Gold in the last few months, were USD and Gold gained. One has to be careful not to be cought on the wrong side. Gold eventually will go highier, but after this correction.
I have calculated Dynamic Time Projection which falls on Monday the 9th , as a singnificant Low (because the trend on a highier TF is up, this Low might come on Time or ealier), if so this Low should be around one of fiboacci zones where there is confluence of different fibs counts. This calculation has taken the Fri 30 Jan as a significant high, which should not be surpassed before the 9th Feb if this count has got any validity.
Let see how it pans out.
 
Last edited:
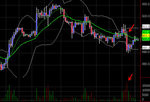
i am currently heavily short gold over the next few days-week, main target is the 50ma and i will be scaling out on the way. first target to cover 1/3 is $880
 
huge volume on this downmove i think ALOT of longs got shaken out here. much higher volume than any of the move up

1hr TF
 

Attachments

  • ss2.jpg
    ss2.jpg
    78.6 KB · Views: 285
I have calculated Dynamic Time Projection which falls on Monday the 9th , as a singnificant Low (because the trend on a highier TF is up, this Low might come on Time or ealier), if so this Low should be around one of fiboacci zones where there is confluence of different fibs counts. This calculation has taken the Fri 30 Jan as a significant high, which should not be surpassed before the 9th Feb if this count has got any validity.
Let see how it pans out.

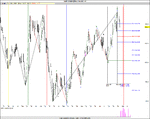
There is a recognisable impulsive 5 EW structure on the last significant move up, which should be followed by retracement ABC EW. DTP is calculated by taking into account confluence of various Fib time projections, trading bars and time cycles, it is expressed as a histogram at the bottom of the chart, where the highiest line idicates the highiest probability of the next significant turning point. Please read the massage above regarding the timing of this next Low point). TCR is a simple Fib time projection using two dates 15th (Low) Jan to 30th Jan (High) and projecting it forward from the High of the 30th Jan. The first blue vertical indicates fib 0.50 (Fri 6th Feb)and the first red vertical line indicates 0.618 (Mon 9th Feb). The other coloured vertical lines represent lunar months indicating equal period of time which I use in Delta.
 

Attachments

  • Gold EW 03-02-09.gif
    Gold EW 03-02-09.gif
    155.2 KB · Views: 237
Last edited:
Genics: Where do you get the volume data for gold?

2be: Very good analysis, but,
are you short or neutral?
 
Genics: Where do you get the volume data for gold?

2be: Very good analysis, but,
are you short or neutral?

Hi Jer08,
I use EOD data from CSI as data feed for Dynamic Trader software, and they have volume indicator there as well. on a shorter TF I use MT4 with FXPro, but I do not trade with them. The histogram below the attached chart is Dynamic Time Projection, it is a report generated by the DT software indicating a possibility on the next swing turn
I am short with a larger traling SL atm. Markets are very choppy atm, so now adays I rely on Momentum using shorter TFs, and the other analysis on a highier TFs. Historic cycles count like Delta have been very challenging in such volitilie markets, but once things are more settled I shall use them more.
Regards,
2be
 
Thanks 2be.

I haven't found using the Volume Indicator particularly useful nor reliable based on my past experience. May be that's just me.

Back to gold, I recken next two days's events may cause huge volativity/whipsaw, hence I have no positions.
 
Thanks 2be.

I haven't found using the Volume Indicator particularly useful nor reliable based on my past experience. May be that's just me.

Back to gold, I recken next two days's events may cause huge volativity/whipsaw, hence I have no positions.
Retracements often are in a very usure territory, as by the nature of the flow they are against it. EW and Delta counts (when I can discern them) are of good assistance, as it is possible to establish a position trade with multiple entries, and hold the position for few days, and on the top it is possible to scalp Gold going both ways, but safer in the direction of the next swing point and away from the last one. On intraday trading I use reasonable SL and take profit/s at 50 to 80 points, using M5,M15 and H1 TF with some momentum indicators and a few MAs. The idea is very simple, on this shorter TF I go in the direction of indicated by momentum, and use the gearing. If I go against the trend, eg; in the oposit direction to the expected swing point, my established position acts as a natural hedge, if I go with it, then I use SL, and take the profit/s of the shorter trades when the momentum changes on M5 and is confirmed by M15 or H1. It is a very simple approach, but in these volitilie markets I take momentum as a reasonable indicator of the price action. I am not boderred when I miss the trade or catch only a proportiopn of the move on the intraday trades, as long as I am profitable. As an example there was a good short entry (in the direction of the expected swing on a highier TF) at 904.50 about an hour and half ago,momentum was oversold, fractal created on Bollinger std3, I do not need much more to go short. I also use a Zigzag on a smaller TF, and Bill Williams Aligator, to establish whether there is angulation or a parallell move. Angulation + BB3 + Fractal = investigate whether the price is in the extreeme, if so and in accordance with a Higher TF pull the trigger. It takes some time to get around this approach which I have been using for intraday trading, but once masterred it produces good results, and one can trade or leave it as on the other hand there is still the position in place.
Hope I have not borred you too much.
Regards,
2be
 
Last edited:
"Hope I have not borred you too much."

No, you haven't.
In fact excellent in my opinion.
I guess you have a multi-monitors set up for all your different TFs?
 
"Hope I have not borred you too much."

No, you haven't.
In fact excellent in my opinion.
I guess you have a multi-monitors set up for all your different TFs?

Yes I do, and trade from different accounts so I do not confuse myself with different trades. On the subject of multi-monitors, I just view them as tools, and do not like to switch between different widows. For me personally several monitors work well. The advantage far exeedes the cost. MT4 seems to take a lot of computer power, so I have also turned to get a few of them and a stand by just in case. The profits generated by trading are good, so why not to make trading more comfortable, and during the winter, there is no need for the central heating, nor a "solarium".
 
I am holding short position still and have added another short for 80points down with 30points SL as an intra day trade.(sold :906.10)
 
Back
Top