B
Black Swan
It's always disappointing to witness comparitively inlelligent traders bitching like no marks on a meaningless footy forum, and to simply dismiss someone's belief in a system (they may have used to some success) illustrates ignorance that belongs in said footy forums. Respect all styles is something that is often cited in martial arts circles, I'd suggest adopting this philosophy before 'kicking off' and closing your mind... It may all lead back to "price action is everything" but so what? Why simply write other ideas off? The journey of discovery may be enlightening 😕
Why Isn't Everyone Making Money?
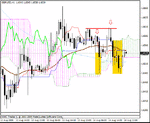
Although it was created back in 1968, this charting technique did not gain international attention until the 1990s. It has since been applied by traders worldwide. Despite its success, the Ichimoku chart still has some drawbacks.
Empirical decision making – As with most technical analysis, empirical decision making is required when determining the time period to use. Keep in mind that the time periods are the only thing making this technique different from a moving average analysis, so it is critical to fine-tune (optimize).
24-hour markets – Markets which operate 24 hours a day, like the currency market, are without an actual set open and close price. To get around the problem, traders often make the calculations in real-time or use the open and close times that are closely associated with the currency pair being traded. For example, for the EUR/USD, it would be wise to use the New York open and close since that is when the majority of trading occurs.
Occasional short time between trades – There will be times when the buy and sell signals occur within close proximity. In a world without commissions or bid/ask spreads, this would not be a problem; however, quick trades like this can cause commissions to eat into your profits.
Conclusion
When Goichi Hosoda developed the Ichimoku Kinko Hyo charting technique, he was definitely onto something. The technique gives traders an easy way to determine buy and sell signals, support and resistance levels, trends, and signal strength. However, the charting method is not without its drawbacks, such as its need for empirical decision making and time period definitions, and its indications to make high frequency trades. Despite these flaws, the technique is employed often by the international trading community, and can prove to be an asset to any trader.
A Glance at an Equilibrium Chart


