trendie
Legendary member
- Messages
- 6,875
- Likes
- 1,433
if anybody wants an alert-type thing using RSI or Stochastics, here is something I did, and have been using on MT-4.
NB: Bar-0 is current bar. Bar-1 is last bar, Bar-2 is bar before that. (ie, it counts backwards)
It looks for OverSold and OverBought conditions on RSI and Stochastics.
(if you dont one of them you "comment them out" by putting "//" in front of the line.)
what it does is see if the indicator has "hooked" beyond the user-defined values.
eg; on RSI, if Upper value is 80, it will give you an alert if the last closed bar (Bar-1) is lower than the bar before AND the bar-before (Bar-2) was above 80. This means the price has hooked down after rising above the threshold value of 80.
similar for Lower values, except the indicator value has to hook upwards after being below the threshold.
this concept is also applied to Stochastics.
the Alert shows:
the currency pair being alerted. eg, GBPUSD
the time-frame on which it triggered, eg, 5 (means on 5-min chart)
a short-code for the event. eg, RSI-OB, RSI-OS, STX-OB, STX-OS.
the date/time it happened, chart-time. NB: this can be different from PC-time, due to brokers, etc.
the CLOSE price of last closed bar. eg, 2.0244
the indicator values changing. eg, 18.50 >> 21.5. (this means the indicator hooked from 18.5 on Bar-2, and was 21.5 on last bar, showing indicator is hooking up)
the alert is by no means perfect, but has removed the psychological element of trying to dither over best-price of when to place a trade, and also takes me away from the screen, reducing over-analysis, and just letting the trade get on with it.
also, the alert acts as a reminder to come and check progress.
ultimately, it is only an aid, and the trader must press the buy and sell buttons themselves.
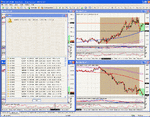
EDIT: first screen-shot shows the user-interface entering the triggering parameters, eg, RSI value, and the Upper and Lower levels that trigger an alert. similarly for Stochastics lower down in same frame.
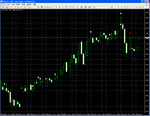
second screen-shot shows what the alerts display on the screen. (these can also be sent via SMS to a mobile.)
The attached file, x_RSI_Stochs.txt needs to be saved to the indicators directory, and saved as x_RSI_Stochs.mq4.
Attachments
Last edited:


