Lightning McQueen
Moderator
- Messages
- 5,029
- Likes
- 841
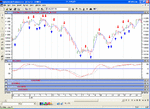
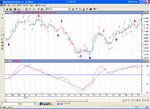
Heres a really simple strat I found on the net that eyeballs up on charts ok.
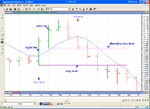
Plot a 5 period SMA on a OHLC bar chart of an instrument and time frame Of your choice eg Dow 15 min chart or FTSE 100 daily chart etc:
1. when the price bar penetrates up through and closes above the MA go long.
2. when the price bar penetrates down through and closes below the Ma go short.
3. sit back and collect your wedge!
Nothing at all new here I know but a few more rules or used as a trigger for your own plan it could have some legs in it.
Have fun
Don
Last edited:


