trendline confusion on daily/hourly

jonboy123

Well-known member
Messages
400
Likes
3
hi,
this has been bugging me over weekend.

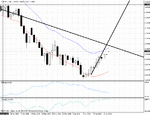
look at daily trendline going up from white candle....right, the 3rd but last candle is 17th june........ its clearly BELOW the trendline
as are both candles before and after it.

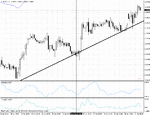
now look at hourly chart.
all the candles are ABOVE the same trendline......

i dont get this.
can someone help explain?

thanks.
 

Attachments

  • daily confusioih.gif
    daily confusioih.gif
    25.2 KB · Views: 422
  • houly confusion.gif
    houly confusion.gif
    26.1 KB · Views: 428
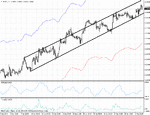
heres another example....that is confusing me.

hourly candle chart, drew two trendlines, like a channel........

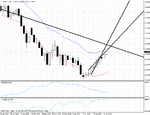
then look at the same trendlines on the daily.....they are crossing......
why are they crossing? they are not crossing on the hourly
 

Attachments

  • hourly parrallel.gif
    hourly parrallel.gif
    28.3 KB · Views: 394
  • hourly agin con.gif
    hourly agin con.gif
    24.9 KB · Views: 360
Yeah this is because on the daily chart it joins two points, and treats those lows as if they are one day apart. But when you go to the hourly chart, those points aren't actually 24 hours apart. So you would get a different line.

As example, if you join the lows of 10th/11th June on a daily chart on EURUSD, the 10th June low (11957) is at 01:00, and the 11th June low (12045) is at 16:00 when you look on your hourly chart. Now if you draw a line on the HOURLY chart from 11957 at 01:00, to 12045 at 01:00 (on 11th June, 24 hour apart) you should get the line that you see on daily.
 
thankyou.
i understand your paragraph 2.
so this is how you draw trendlines on diff time frames? eg if using daily and hourly?
as compared to drawing trend line on one time frame and then using that pre drawn trendline on another time frame........

my second post on this thread.
the hourly bottom trendline is touching prices at around 17th june.
but that same trendline is not even touching ANY price of 17th june daily candle...

this is not clicking in my head 100%
 
There are all kinds of problems with trendlines, in that if you have weekend data that alters the slope to someone who doesn't. If there is a holiday and markets are closed, that can alter the slope etc.

Again in the second post it is the same thing. You are joining two values (on daily chart), so you are joining two values that are 24 units (hours) apart. On the hourly chart, they may not be 24 units/hours apart, and if they are not the slope cannot be the same.
 

Attachments

  • trendlines.jpg
    trendlines.jpg
    97.2 KB · Views: 335
thankyou for helping.

question: if a trendline is touching hourly candles at two points in time over a few days or day.......itshould be touching the daily candle on the daily
Answer: the answer is no .... ? correct?

so kind of time distortion happens....

the candles re-adjust accordingly on diff time frames to show the price movement, and the trendline gets distorted.

the price on the right hand side, that remains....the time line at bottom expands/contracts making the trendline skew.......is this correct thinking?

so do and should people draw trendlines specific to diff time frames? ive heard of drawing daily trendlines and then zooming into hourly yet using the same pre drawn daily trenline.

but it seems going in the oppossite way, eg drawing trendline in hourly chart, then going to daily, that doesnt seem to be any use does it? like a small time frame says nothing regarding the longer time frame..........yet longer frame line can give guidance to shorter time frame chart........agree?

sorry...forget about price ? joining two values, yes...two values in price... or two values in time?
 
You are taking two prices and joining them up from different times. However, your charting software, recognises that you want to join the low of one particular day to the low of another day, and then when you look on the hourly chart it has joined up those lows. But you should not expect the lines to look the same on daily.

I am not sure if I am helping here, but think of it from the software's point of view. You tell it to join up the low point on day A, to the low point on day B. That is all the info you're giving it. You then want to look at the line in an hourly chart. You didn't tell it which hour, just the day. The software can do one of two things when it is displaying it on the hourly chart:

Either
1) It can take the value of the low of day A, and assign it a specific time (say noon), and do the same with the low of day B, and draw the line between them. Note you have given the software two prices to join, but on the hourly chart it has to choose from which hourly bar this line starts.

Or
2) The software can realise that you want to join the lows up, and so it goes and finds the time on the hourly chart where that low was on day A, and finds the time for the low of day B, and joins them up.

It cannot then go back and change your daily trendline, because you drew that, and you'd get pretty annoyed if it started moving it around 🙂 So the daily line is stuck as you drew it, and you shoudln't expect this to always look the same as it does on the hourly chart.

so do and should people draw trendlines specific to diff time frames? ive heard of drawing daily trendlines and then zooming into hourly yet using the same pre drawn daily trenline.
Yes people draw trendlines specific to different timeframes, hourly is quite popular, but some people also use a 5min, or a weekly. All up to you. But yes also, you can draw the trendline on daily and go down to the hourly and look at it there, because if your software is doing option 2 (above) then it has joined up the lows on the hourly.

but it seems going in the oppossite way, eg drawing trendline in hourly chart, then going to daily, that doesnt seem to be any use does it? like a small time frame says nothing regarding the longer time frame..........yet longer frame line can give guidance to shorter time frame chart........agree?
That's a more general quesiton than just trendlines. I wouldn't say the shorter timeframe says nothing about the longer, but I would agree that the longer timeframes are more significant, if that is what you mean.
 
but it seems going in the oppossite way, eg drawing trendline in hourly chart, then going to daily, that doesnt seem to be any use does it? like a small time frame says nothing regarding the longer time frame..........yet longer frame line can give guidance to shorter time frame chart........agree?

It's quite poetic, in a way. A trend on a smaller timeframe doesn't dictate the overall direction on the higher TF.
 
Back
Top