Top Down Approach for $INDU and Stocks

leovirgo

Senior member
Messages
3,161
Likes
156
Ok, here I am starting a new thread to help newbies. It doesn't mean that I am not a newbie, I have a few years experience of learning how to trade. I had to learn the hard way. And I am not an expert, not yet, but I believe sharing is good. My online mentor Grey1 said .. "open the door and the door shall be opened to you in mysterious ways..". I will be posting how I trade, specifically on $INDU (ym futures) and US stocks. My 2cents to newbies is .. "Pay attention to broad market".

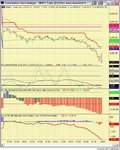
Today, for example, is 'No Buying day'. US congress voted down the rescue package. Many fund managers thought it had to be passed. It didn't and the market tanked.

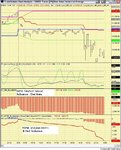
Here is the set up and how it should be traded.

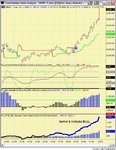
1. NYSE market breadth was bearish ( < -2000 ) since the opening. It means only one thing to me. It's not a buy day. If it is consistently bearish (red) the whole day, it is a good set up for shorting the dow.

2. NYSE Volumes were bearish too. (On buying days, it'll be blue colors or neutral colors.)

Regardless of the outcome to the vote, the market set up, to me, was to the downside. So we can sell the market at the red dots. Use any kind of method to sell the market today.

[ If the bailout had been passed, then we should see the rise in Market Breadth and NYSE Volume upticks. ]
 

Attachments

  • 080929 INDU.jpg
    080929 INDU.jpg
    164.6 KB · Views: 556
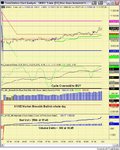
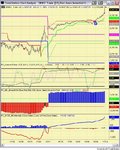
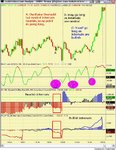
Triple Bull Power Buy

The chart speaks for itself.

080930%2BINDU.jpg
 

Attachments

  • 080930 INDU.jpg
    080930 INDU.jpg
    144 KB · Views: 423
Last edited:
not being a wise guy.
You do mean today, as in 30/09/2008 as not being a buy day?? We closed up 50 odd handles on the spx today...?
cheers.
 
not being a wise guy.
You do mean today, as in 30/09/2008 as not being a buy day?? We closed up 50 odd handles on the spx today...?
cheers.

My post no #1 refers to 29th. Second post is about 30th. Check the dateline in the posts mate..who is not wise? cheers
 
Last edited:
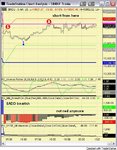
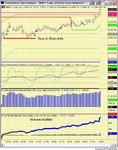
Today, the market internals were a bit bearish, $ADD in red territory. But volumes were neutral-short bias until mid day. see the chart below..
 

Attachments

  • 08-10-01.jpg
    08-10-01.jpg
    86.7 KB · Views: 372
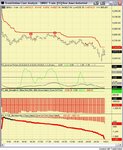
Listen to the market.. it rarely goes wrong.. this was a very good move!!
 

Attachments

  • 081002 INDU.jpg
    081002 INDU.jpg
    129.1 KB · Views: 365
Listen to the market.. it rarely goes wrong.. this was a very good move!!

could you elaborate on your entry criteria please leo, i get the market conditions aspec but would like to see how you define your entry point good thread by the way.
 
could you elaborate on your entry criteria please leo, i get the market conditions aspec but would like to see how you define your entry point good thread by the way.

When the NYSE market internals are bearish, I go short at oscillator crossings, such as Inverse Fisher. On the chart there was a red 'show me' dot which says oscillator crossing has happened when market conditions are bearish. My stoploss would be the red supertrend line, which is basically 3ATR in 5mins timeframe. Target is abit subjective, but the blue line (Buy number, i.e the anticipated lowest pivot ) and the green line ( which is support line based on 1Hr range) are good points to cover short positions as consolidation tends to happen at these level. hope this helps..
 
9th October INDU below 8600

Another down day.. with red dots to sellshort. It was scary to sell at lowest of lows when volumedetla turns bullish.. but marketbreadth and net volumes were so bearish that it fell to a new low..:-0
 

Attachments

  • 081009 INDU.jpg
    081009 INDU.jpg
    143.3 KB · Views: 335
13th October Power UP day

Market internals were so bullish.. that scalping a LONG from blue dot nettted +300pts!! This is the correct way to trade on days like this. (on NYSE there are 15 stocks advancing for 1 decling stock)
 

Attachments

  • 081013 INDU powerup.jpg
    081013 INDU powerup.jpg
    144.4 KB · Views: 333
15th Oct 2008... needless to say.. it was a bearish day.. INDU fell nearly 800 pts. Market Internals were bearish since the opening.
 
20th October POWER UP buy day

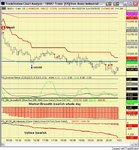
For $INDU, market breadth and volumes are the market barometers which tell the logical direction to trade. This kind of approach takes out emotion and personal bias from trading.
 

Attachments

  • 081020 INDU.jpg
    081020 INDU.jpg
    137.4 KB · Views: 354
22nd POWER DOWN DAY

No need to guess. It was a day to sell. Listening to market internals is THE way to trade. No emotion, no bias, no talking heads, no noise....
 

Attachments

  • 081022 INDU Power Down.jpg
    081022 INDU Power Down.jpg
    129.4 KB · Views: 305
Hi,
what exactly are the "market internals" and "market breadth"? They dont appear to be the trin or tick?

Are they customs indicators with tradestation?
 
Market breadth is the difference between advancing issues and declining issues. Net Volume is also the difference between up and down etc.
 
Is Market Breadth part of your package from Tradestation as it is not included with mine ?


Paul
 
Paul
I do not need special subscription from TS. It's called $ADD. It should be available in IB I guess. Or you can subtract $DECL from $ADV. They show advance decline for NYSE. In my observation, NYSE is good enough for our purpose. regards,..
 
Hope every had a chance to get on board today's 900 pts ride up. Here is my take..
 

Attachments

  • 081028 INDU late power up.jpg
    081028 INDU late power up.jpg
    129.3 KB · Views: 288
Oversold in 3 market conditions

Here I am demonstrating the basis of my system. Generally we can buy/long when an indicator is oversold. I use MACCI as an example. In the chart, there are three oversolds spots, A, B and C. You will see how market internals are helping/preventing a long entry. It is plain simple. Indicators themselves have no edge. Market Internals do provide some edge.
 

Attachments

  • 081027 28 INDU MACCI Internals.jpg
    081027 28 INDU MACCI Internals.jpg
    136.1 KB · Views: 303
Hi Leovirgo,
I've never been convinced of the merit of looking at market breadth / internals and have taken the view previously that they're more likely to muddy the waters than they are to clear them. However, I have to say that the chart attached to your last post is very clear and simple (the way I like it), so perhaps I need to revisit the idea! Two questions if I may:
1. Sometimes it's necessary to cherry pick a chart to illustrate the point one wants to make when posting on a forum such as this. (I do it all the time!) Would I be right in thinking that most days it isn't anything like as clear cut as your example with the oscillator, breadth and internals all lining up neatly? I'm just trying to gauge how typical the chart is and the level of skill required to interpret it.
2. Like you, most forum members seem to use Tradestation and I'm with eSignal. Do you know (or does anyone else know) if and how I can set up a similar chart in eSignal?
Cheers,
Tim.
 
Back
Top