In the first and second parts of this series I looked at some of the various elements you will need to master if you are to have a chance of succeeding at trading. In this final article, I will run through a strategy I have used in the past to illustrate some of the concepts previously discussed.
Basic Strategy
The UK stock markets tend to be range-bound, especially on a short-term basis. This strategy looks to buy low and sell high, so it is swing based. It uses the basics of support, resistance and trendlines combined with money management as I've discussed earlier.
The Rules:
Here's an example of how the strategy works - using the Royal Bank of Scotland as an example:
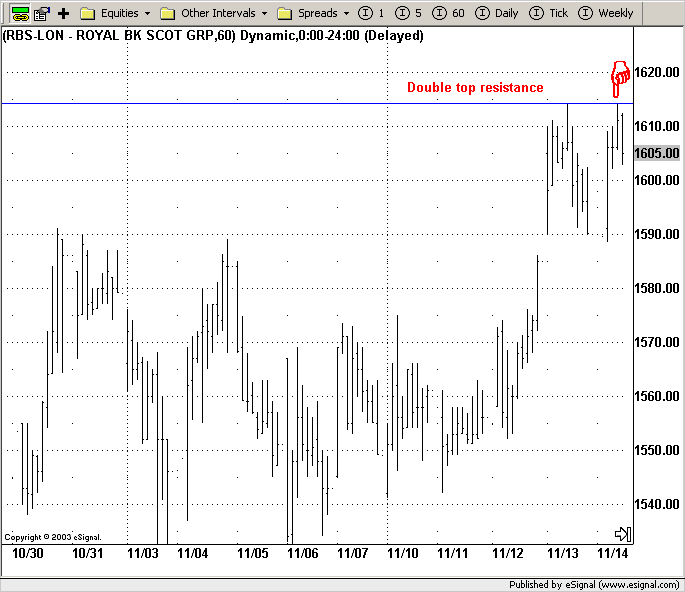
There is resistance at 1614, which has been tested and failed to break above that point. There is a potential trade here, but the price says 1605 which, with a stop at 1616 and a target at around 1590, would give a Reward / Risk ratio of 1.36 - which is too small to trade. However, if we enter a limit order in the market at 1608 then we will get a Reward / Risk Ratio of 2.25. Let's see if we get a fill on the next bar.
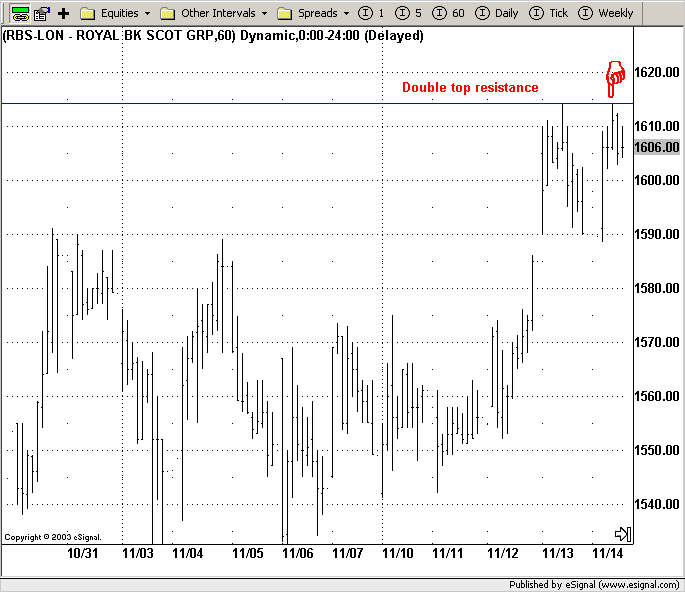
Yes we got filled. That last bar shows a high of 1610 and a low of 1604, so our
limit order at 1608 would have been filled.
Ok, so we are now short with a stop at 1616.
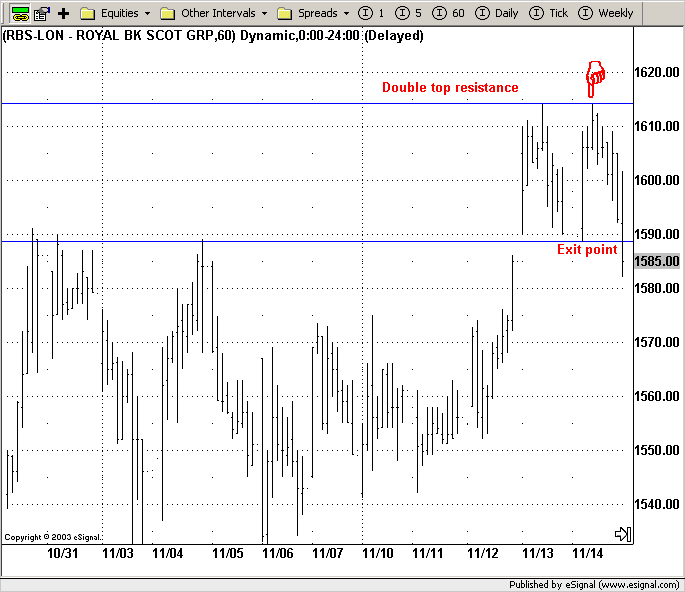
For the next few bars the price moves down slowly but surely. Once price hits 1590, I'm out of the trade and taking the profits. Is that the right decision? Well...

No. The price fell further. Would I be happy taking profits where I did? Yes.
The next trade set-up is at this point. The price has bounced off the previous support level, so this is now resistance. With the price at 1584, a stop at 1590 and a target of 1557, we have a great Reward / Risk ratio of 5.5. So we are now short (as we entered on a market order to get a price of 1584), with a stop at 1590.
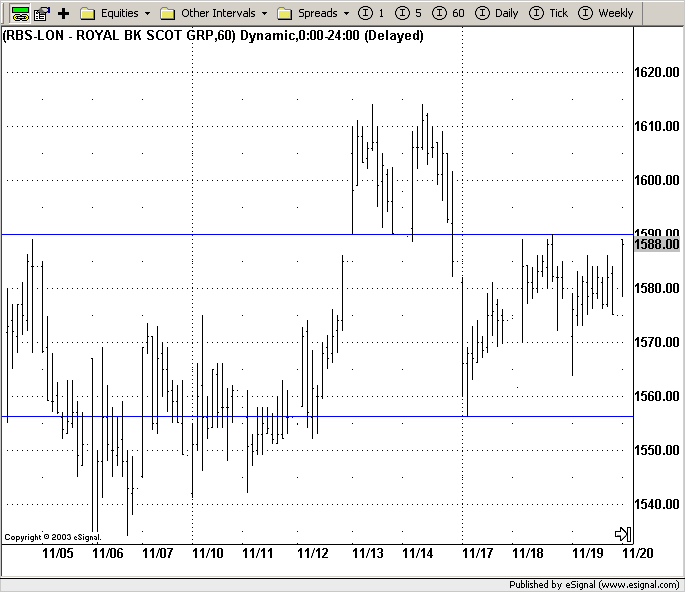
Oh dear, the price has gone against me so I'm stopped out for -6.
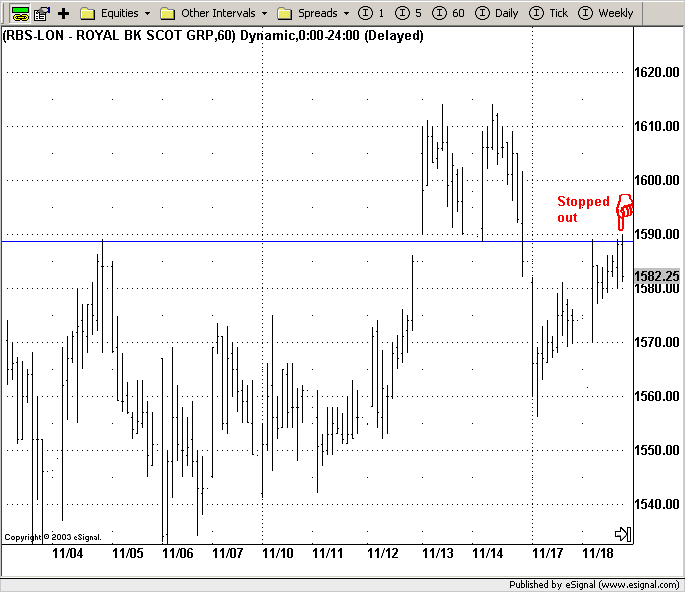
Here's the next set-up. Again a test of the 1590 mark. The problem is price hasn't quite tested it, and on the next bar this happens.
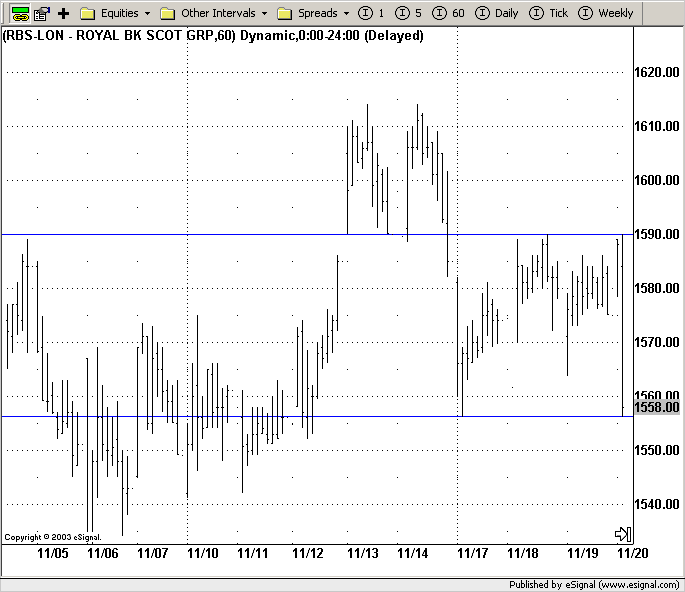
Wow! What a fall, could you have caught it? Possibly, but you would have had to be quick, and if I managed to get in on the trade then I would be exiting at 1558.
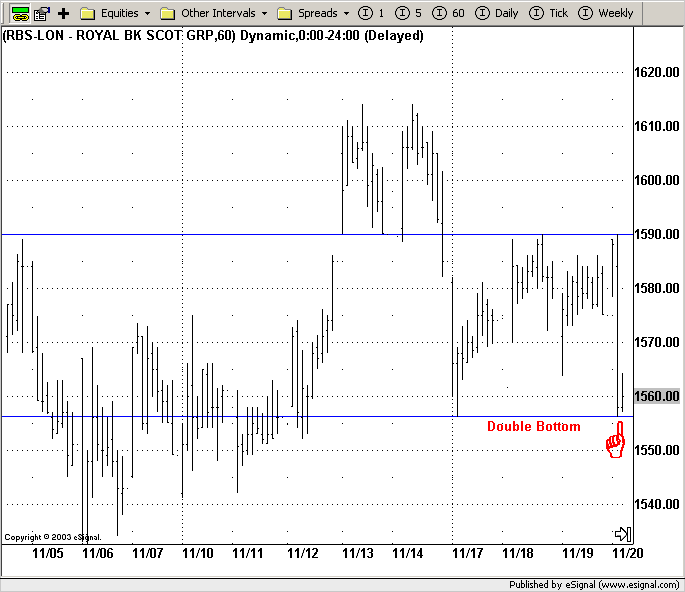
On the next bar, the price does indeed bounce. Price at 1560, stop at 1554 and a target of 1590 gives a
Reward-to-Risk ratio of 5:1. So long with a market order to get filled at 1560.
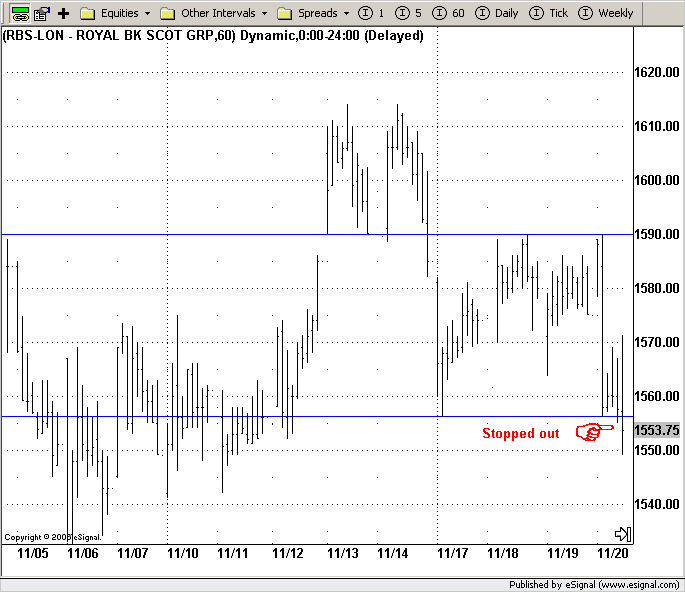
After threatening the stop on the previous bar, the stop got hit on this one. Out for -6 again.
This is where things get tricky and at this point some people would abandon this strategy. Well we have had 2 losses in a row. The ability to carry on with a strategy, which in the short-term is failing, is where a strong psychological make-up comes in.
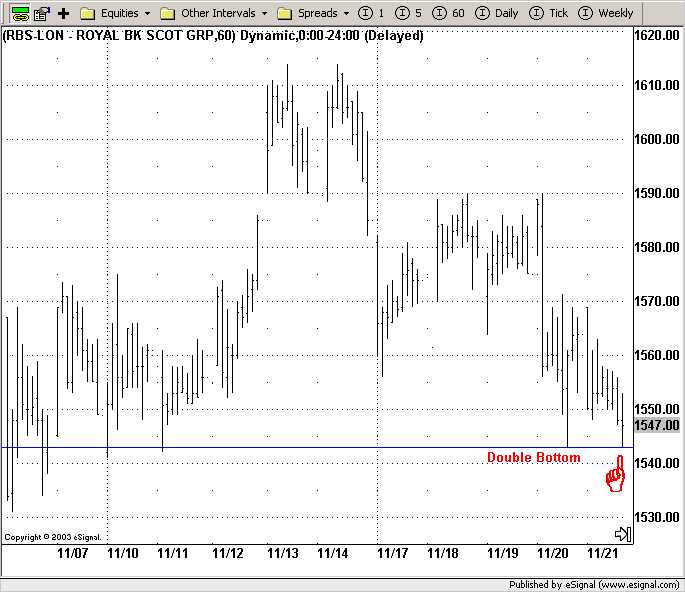
The next set-up comes here. A bounce off the previous support level gives a long entry at 1547 with a stop at 1541 and a target of 1570. So a Reward / Risk ratio of 3.83.
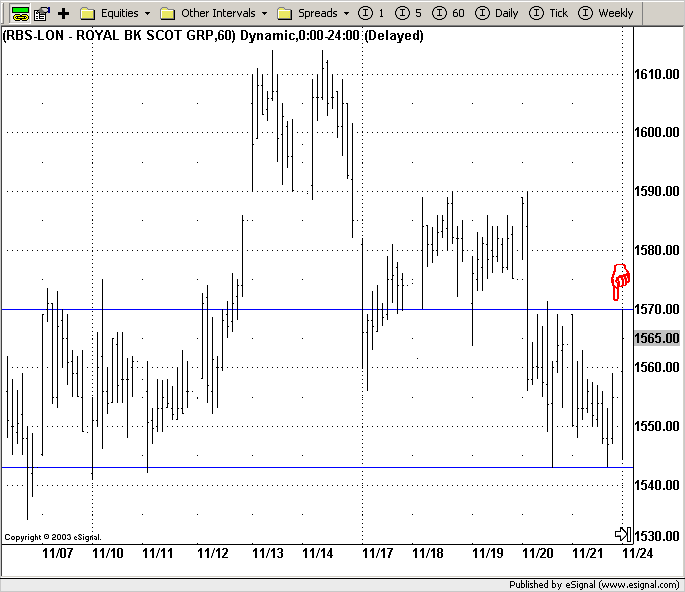
The exit comes a couple of bars later as price hits 1570. After that the price carried on all the way up to 1635, but again I was happy with the profit that I took.
So there you are, a few easy and relaxing trades in Royal Bank of Scotland. The one thing I would say with this, and it goes for much of trading, you need patience. Three or four trades in the space of 2 weeks is not a great deal. So the majority of the time you will be waiting for the trade, which is not always easy to do.
This strategy is by no means perfect and it could be improved in many areas, however you should find it useful as a starting point which you can develop as you become more experienced - and remember while you are gaining experience either paper trade or use small amounts and never risk more than you can afford to lose!
Basic Strategy
The UK stock markets tend to be range-bound, especially on a short-term basis. This strategy looks to buy low and sell high, so it is swing based. It uses the basics of support, resistance and trendlines combined with money management as I've discussed earlier.
The Rules:
- Look for a test of support or resistance or a trendline that fails to break.
- If it tests support and bounces up, then go long and place the stop just under the support level.
- If price tests resistance and bounces down, then go short and place the stop just above the resistance point.
- Take profits at a test of previous support or resistance.
- Once the trade is in profit (how much is up to you) move the stop to break-even, so you are then sitting on a "free trade."
- Trade stocks, that are in the FTSE 100, and that have a high average daily range.
- Trade off a 60 minute bar or
candlestick chart. Look for a Reward / Risk ratio of at least 2:1 - ideally 3:1.
- No trades held overnight if the company is reporting the next day.
Here's an example of how the strategy works - using the Royal Bank of Scotland as an example:

There is resistance at 1614, which has been tested and failed to break above that point. There is a potential trade here, but the price says 1605 which, with a stop at 1616 and a target at around 1590, would give a Reward / Risk ratio of 1.36 - which is too small to trade. However, if we enter a limit order in the market at 1608 then we will get a Reward / Risk Ratio of 2.25. Let's see if we get a fill on the next bar.

Yes we got filled. That last bar shows a high of 1610 and a low of 1604, so our
limit order at 1608 would have been filled.
Ok, so we are now short with a stop at 1616.

For the next few bars the price moves down slowly but surely. Once price hits 1590, I'm out of the trade and taking the profits. Is that the right decision? Well...

No. The price fell further. Would I be happy taking profits where I did? Yes.
The next trade set-up is at this point. The price has bounced off the previous support level, so this is now resistance. With the price at 1584, a stop at 1590 and a target of 1557, we have a great Reward / Risk ratio of 5.5. So we are now short (as we entered on a market order to get a price of 1584), with a stop at 1590.

Oh dear, the price has gone against me so I'm stopped out for -6.

Here's the next set-up. Again a test of the 1590 mark. The problem is price hasn't quite tested it, and on the next bar this happens.

Wow! What a fall, could you have caught it? Possibly, but you would have had to be quick, and if I managed to get in on the trade then I would be exiting at 1558.

On the next bar, the price does indeed bounce. Price at 1560, stop at 1554 and a target of 1590 gives a
Reward-to-Risk ratio of 5:1. So long with a market order to get filled at 1560.

After threatening the stop on the previous bar, the stop got hit on this one. Out for -6 again.
This is where things get tricky and at this point some people would abandon this strategy. Well we have had 2 losses in a row. The ability to carry on with a strategy, which in the short-term is failing, is where a strong psychological make-up comes in.

The next set-up comes here. A bounce off the previous support level gives a long entry at 1547 with a stop at 1541 and a target of 1570. So a Reward / Risk ratio of 3.83.

The exit comes a couple of bars later as price hits 1570. After that the price carried on all the way up to 1635, but again I was happy with the profit that I took.
So there you are, a few easy and relaxing trades in Royal Bank of Scotland. The one thing I would say with this, and it goes for much of trading, you need patience. Three or four trades in the space of 2 weeks is not a great deal. So the majority of the time you will be waiting for the trade, which is not always easy to do.
This strategy is by no means perfect and it could be improved in many areas, however you should find it useful as a starting point which you can develop as you become more experienced - and remember while you are gaining experience either paper trade or use small amounts and never risk more than you can afford to lose!
Last edited by a moderator:

