Fibonacci analysis leaped into the technical mainstream late in the 1990s. Futures traders had been quietly using this charting tool for several decades when Net-based, real-time software ported it to the equity markets. Its popularity exploded as at-home traders experimented with the arcane math and discovered its many virtues.
Leonardo of Pisa (c. 1170-1250), also known as Fibonacci, studied math among the Arabs and introduced algebra to Europe, as well as a numerical sequence that appears throughout nature. The core logic of his discovery is simple: beginning with 1+1, the sum of the last two numbers that precede it creates the next value in a Fibonacci progression.
So with this math in hand, the starting Fibonacci sequence looks like this: 1+1=2, 1+2=3, 2+3=5, 3+5=8, 5+8=13, 8+13=21, 13+21=34, 21+34=55. And so on to infinity.
Commonly observed market retracement levels of 38%, 50% and 62% are derived from ratios of this logical number series. Traders apply Fibonacci levels to their charts between the start and end points of a notable trend and then examine the price patterns. In a nutshell, they look for bounces and reversals when a “Fib number” gets hit during a pullback.
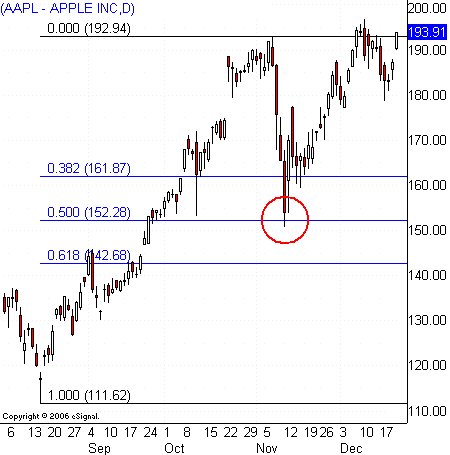
Fig 1
Here’s an example of how Fibonacci retracements can affect price action. Apple (AAPL) zoomed from 111 to 192 in a vertical move that topped out in November 2007. The stock then rolled over into a deep pullback that retraced exactly 50% of the prior rally, before it bounced back to the high and resumed its long uptrend.
Of course, not everyone believes in this esoteric methodology. In fact, many traders are quite skeptical, dismissing this type of analysis as nothing more than market voodoo. But that hasn't stopped me from using it regularly in my trading since the mid-1990s because it helps make more informed buying and selling decisions.
Realistically though, the dynamics underlying Fibonacci have become harder to trade in recent years. The immense popularity of this analysis is the most likely culprit. These days, everyone has a charting program that whips up dozens of Fib numbers in a flash. In turn, this over-application can trigger whipsaws when price hits one of the big numbers.
The trick is to use an original approach with Fibonacci and never trade retracement levels in a vacuum. Instead, look for other forms of support or resistance to line up at commonly traded levels, like 38%, 50% and 62%. For example, when you see a 50-day moving average, a major high and a trendline converge at a 62% Fib retracement, the odds for a bounce or reversal increase greatly.
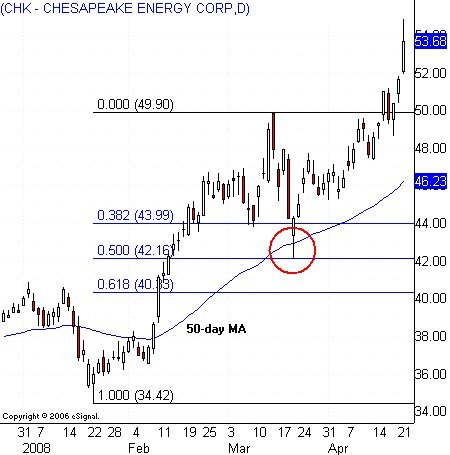
Fig 2
Chesapeake Energy (CHK) shows how this cross-verification process can increase your confidence in buying a pullback. The stock surged higher in January, rising fifteen points in the next seven weeks. It peaked just below 50 and pulled back sharply in a bout of profit taking. The decline ended right at the intersection of the 50% Fibonacci retracement and 50-day moving average. The stock then bounced strongly and headed for new highs.
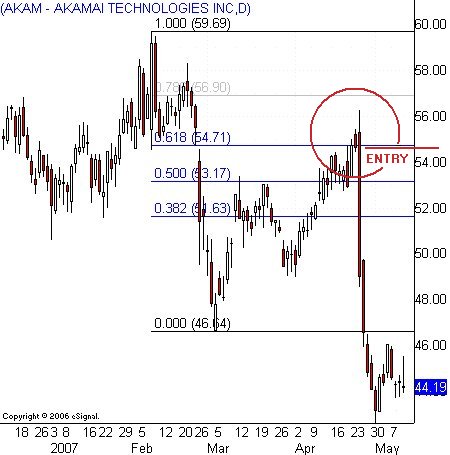
Fig 3
You can also trade the Fibonacci whipsaw. Stand aside when price pulls into a deep retracement level, like 62%. Let other traders take the bait and get shaken out after the countertrend breaks through that number. Then watch for a reversal at or near 78% and a surge that carries the stock back through 62%. Use this crossover as your entry signal, which would be a short sale in this Akamai Tech (AKAM) example.
The whipsaw trade works well because the market usually “punishes” just one side of the bull-bear conflict at a time. So the flushing out of weak-handed short sale positions when the stock breaks above the 62% Fibonacci retracement can set up a contrary and profitable "failure" trade as soon as the price falls back through the contested level.
Let's look at four more setups that take advantage of Fibonacci mathematics. I strongly recommend you add these interesting patterns to your trading arsenal because they will serve you well in the years ahead.
First Rise/First Failure
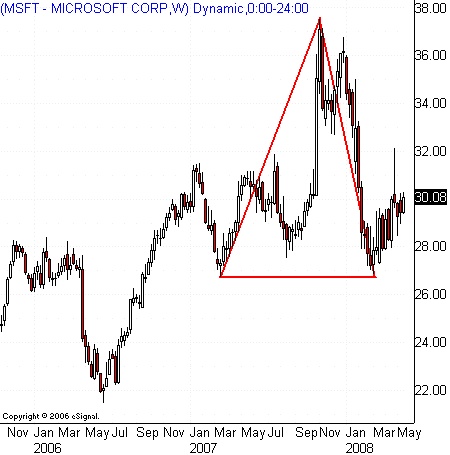
Fig 4
First Rise/First Failure marks the first 100% retracement of a trend wave after a well-established rally or selloff. The pattern provides an early warning signal for a major reversal and change in trend. The theory is simple: the complete unraveling of the last big move in one direction sets up ideal conditions for a sharp thrust in the other direction.
The best way to play the first rise/first failure pattern is to stand aside while the stock tries to reestablish the prevailing trend. The first entry signal is triggered when that effort fails and price thrusts past the edge of the 100% retracement. In the Microsoft example, that would happen on a selloff below 26.
Parabolic Spike
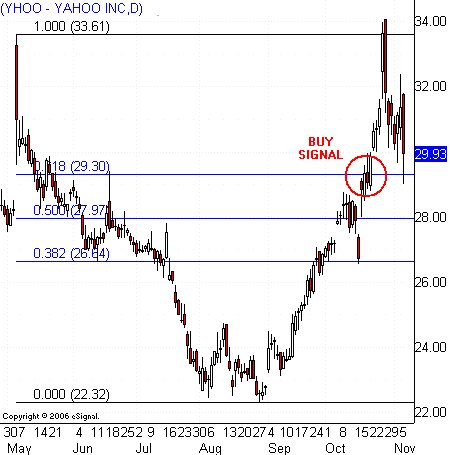
Fig 5
Parabolic movement tends to occur between the 0%-to-38% and 62%-to-100% Fibonacci retracements in all trends. This tendency provides a great tool for finding the big moves before they start. It works this way. Watch for congestion to form at the 38% or 62% level. Then use a simple breakout or breakdown strategy when price moves through the contested level.
The price swing back to 0% or 100% after the 38% or 62% is mounted can be dramatic, with the stock surging quickly back to the old high or low. This strategy works best when you can locate one of these inflection points in advance because it will give you the opportunity to get positioned at the most advantageous price.
Overnight Grids
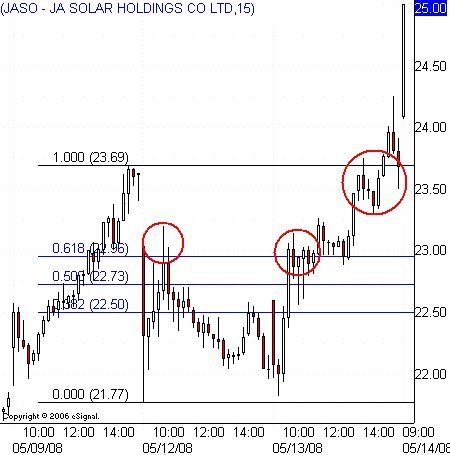
Fig 6
Find an active stock and start a Fibonacci grid at the high (or low) of a session's last hour. Then stretch the grid to the opposite end of the next morning's first hour low (or high). This defines a specific price wave that intraday traders can use to uncover short-term reversals, breakouts and breakdowns. The overnight grid also offers a way to trade morning gaps.
The gap often stretches across a key retracement level, allowing the trader to target low-risk entry points on a pullback. In addition to Fibonacci levels, you can also use the starting and ending points of the gap as support and resistance, where quick swings are expected to occur. Buy and sell signals get even stronger when these levels align with Fib retracements generated by the overnight grid.
Second High/Low
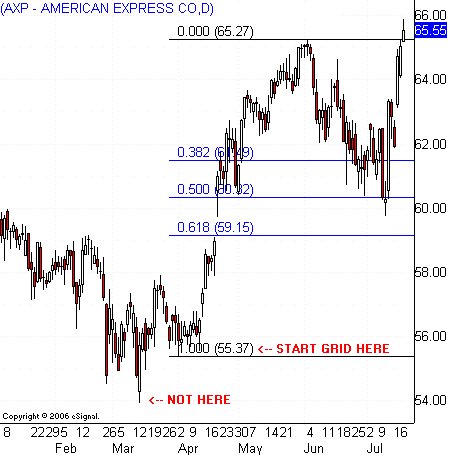
Fig 7
Many traders can't figure out where to start a Fibonacci grid so here's a trick to help you place it where it'll do the most good. The absolute high or low in a price wave isn't the optimal starting point for a grid in most cases. Instead, look for a small double bottom or double top within the congestion pattern where the trend wave begins.
Then, swing one end of the Fibonacci grid over this second high (or low), instead of the first. This small adjustment often does a superior job in capturing retracements of the specific wave that you're trying to trade.
Alan Farley can be contacted at HardRightEdge.com
Leonardo of Pisa (c. 1170-1250), also known as Fibonacci, studied math among the Arabs and introduced algebra to Europe, as well as a numerical sequence that appears throughout nature. The core logic of his discovery is simple: beginning with 1+1, the sum of the last two numbers that precede it creates the next value in a Fibonacci progression.
So with this math in hand, the starting Fibonacci sequence looks like this: 1+1=2, 1+2=3, 2+3=5, 3+5=8, 5+8=13, 8+13=21, 13+21=34, 21+34=55. And so on to infinity.
Commonly observed market retracement levels of 38%, 50% and 62% are derived from ratios of this logical number series. Traders apply Fibonacci levels to their charts between the start and end points of a notable trend and then examine the price patterns. In a nutshell, they look for bounces and reversals when a “Fib number” gets hit during a pullback.

Fig 1
Here’s an example of how Fibonacci retracements can affect price action. Apple (AAPL) zoomed from 111 to 192 in a vertical move that topped out in November 2007. The stock then rolled over into a deep pullback that retraced exactly 50% of the prior rally, before it bounced back to the high and resumed its long uptrend.
Of course, not everyone believes in this esoteric methodology. In fact, many traders are quite skeptical, dismissing this type of analysis as nothing more than market voodoo. But that hasn't stopped me from using it regularly in my trading since the mid-1990s because it helps make more informed buying and selling decisions.
Realistically though, the dynamics underlying Fibonacci have become harder to trade in recent years. The immense popularity of this analysis is the most likely culprit. These days, everyone has a charting program that whips up dozens of Fib numbers in a flash. In turn, this over-application can trigger whipsaws when price hits one of the big numbers.
The trick is to use an original approach with Fibonacci and never trade retracement levels in a vacuum. Instead, look for other forms of support or resistance to line up at commonly traded levels, like 38%, 50% and 62%. For example, when you see a 50-day moving average, a major high and a trendline converge at a 62% Fib retracement, the odds for a bounce or reversal increase greatly.

Fig 2
Chesapeake Energy (CHK) shows how this cross-verification process can increase your confidence in buying a pullback. The stock surged higher in January, rising fifteen points in the next seven weeks. It peaked just below 50 and pulled back sharply in a bout of profit taking. The decline ended right at the intersection of the 50% Fibonacci retracement and 50-day moving average. The stock then bounced strongly and headed for new highs.

Fig 3
You can also trade the Fibonacci whipsaw. Stand aside when price pulls into a deep retracement level, like 62%. Let other traders take the bait and get shaken out after the countertrend breaks through that number. Then watch for a reversal at or near 78% and a surge that carries the stock back through 62%. Use this crossover as your entry signal, which would be a short sale in this Akamai Tech (AKAM) example.
The whipsaw trade works well because the market usually “punishes” just one side of the bull-bear conflict at a time. So the flushing out of weak-handed short sale positions when the stock breaks above the 62% Fibonacci retracement can set up a contrary and profitable "failure" trade as soon as the price falls back through the contested level.
Let's look at four more setups that take advantage of Fibonacci mathematics. I strongly recommend you add these interesting patterns to your trading arsenal because they will serve you well in the years ahead.
First Rise/First Failure

Fig 4
First Rise/First Failure marks the first 100% retracement of a trend wave after a well-established rally or selloff. The pattern provides an early warning signal for a major reversal and change in trend. The theory is simple: the complete unraveling of the last big move in one direction sets up ideal conditions for a sharp thrust in the other direction.
The best way to play the first rise/first failure pattern is to stand aside while the stock tries to reestablish the prevailing trend. The first entry signal is triggered when that effort fails and price thrusts past the edge of the 100% retracement. In the Microsoft example, that would happen on a selloff below 26.
Parabolic Spike

Fig 5
Parabolic movement tends to occur between the 0%-to-38% and 62%-to-100% Fibonacci retracements in all trends. This tendency provides a great tool for finding the big moves before they start. It works this way. Watch for congestion to form at the 38% or 62% level. Then use a simple breakout or breakdown strategy when price moves through the contested level.
The price swing back to 0% or 100% after the 38% or 62% is mounted can be dramatic, with the stock surging quickly back to the old high or low. This strategy works best when you can locate one of these inflection points in advance because it will give you the opportunity to get positioned at the most advantageous price.
Overnight Grids

Fig 6
Find an active stock and start a Fibonacci grid at the high (or low) of a session's last hour. Then stretch the grid to the opposite end of the next morning's first hour low (or high). This defines a specific price wave that intraday traders can use to uncover short-term reversals, breakouts and breakdowns. The overnight grid also offers a way to trade morning gaps.
The gap often stretches across a key retracement level, allowing the trader to target low-risk entry points on a pullback. In addition to Fibonacci levels, you can also use the starting and ending points of the gap as support and resistance, where quick swings are expected to occur. Buy and sell signals get even stronger when these levels align with Fib retracements generated by the overnight grid.
Second High/Low

Fig 7
Many traders can't figure out where to start a Fibonacci grid so here's a trick to help you place it where it'll do the most good. The absolute high or low in a price wave isn't the optimal starting point for a grid in most cases. Instead, look for a small double bottom or double top within the congestion pattern where the trend wave begins.
Then, swing one end of the Fibonacci grid over this second high (or low), instead of the first. This small adjustment often does a superior job in capturing retracements of the specific wave that you're trying to trade.
Alan Farley can be contacted at HardRightEdge.com
Last edited by a moderator:
