Remember the article called Our Jack - the trader who should be a loser, but wasn’t and who should have been more profitable, but didn’t care a jot? Well, I bumped into Jack the other day which was a happy coincidence because I’d been reading a fierce argument on Trade2Win about whether Technical Analysis (TA) ‘worked’ or not. I knew Jack used TA, so I was anxious to hear his views.
"Works", laughed Jack, “It’s just a tool, you know, which just as much ‘works’ as Alexandros’s hammer and chisel did in sculpting the Venus de Milo. No, dear boy, it’s you and me that ‘works’ not the tool.”
I thought that sounded somewhat fanciful so I asked Jack how he used TA as a tool. “I use it to make assumptions about what price might do,” he said, “but it’s how I manage the assumptions and the money that determines whether my account increases or decreases over time. Let me explain.
First, some obvious stuff, but bear with me. Price moves in mysterious ways, but it does have a certain rhythm about it. Don’t take my word for, just open a daily chart of an instrument of your choice, convert it to a line and close point chart, then look for where your instrument has been in trend phase for a few months. Just observable, nothing fancy, with line running bottom left to top right (I’ll talk about up trends for clarities sake, but the same applies to down trends). What do you see? I guarantee you will not be looking at a straight line, or one where every closing point is higher than the one before. You will see something that looks like this because forward and back, forward and back is the rhythm of the market:
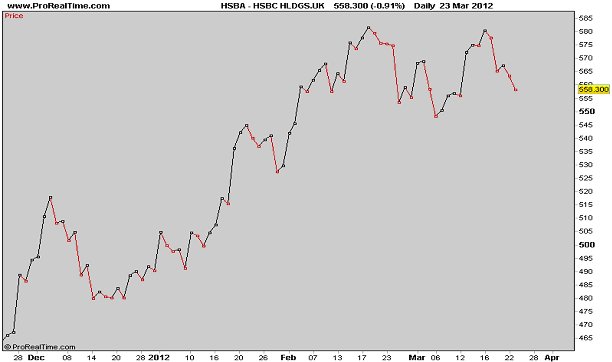
Fig 1
What you observe are counter-trend reactions, some just minor pull backs, some rather more severe and some major reactions. You will also observe that, when a major reaction is over, price first has to recover the lost ground to the point of the high where the reaction started. My assumption is that price will do just that and either test and break that previous high to continue its upward trend or test and fail resulting in a trend reversal or, at least, a significant down move. It is this assumption that sets the framework of my trading where I seek to capture that recovery move, so long as the reward is commensurate with the risk I am prepared to run.
I prefer to take these bits from the trend rather than suffer the major reactions, the last of which almost inevitably continues into a full reversal, wiping out much that had been gained had I stuck with the trend.
Here’s a picture to demonstrate:
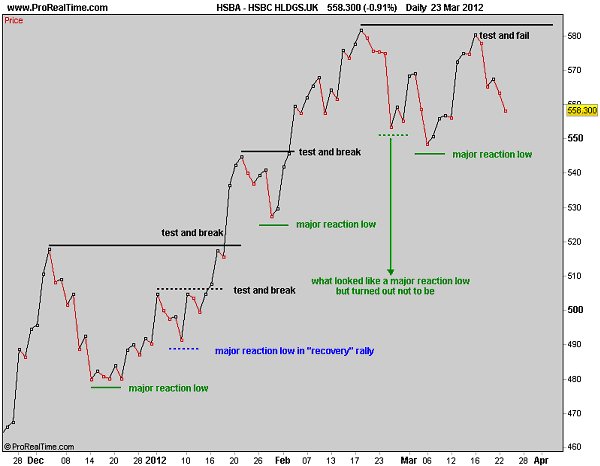
Fig 2
There you are, then, easy isn’t it? Buy the major reaction low, sell at previous high. Next year, Rodney, we’ll all be millionaires!! Well, yes, it is easy when you’ve got the whole picture spread out before you like that, but you can’t trade it because it’s history and about as relevant as reading the form to work out what is going to win the Grand National after you’ve watched the winner being paraded through the streets.
What I do know, though, is how the picture MUST look if the trades that I take as we go along are to be successful and, with less certainty, how price has to move to draw it. So I must make assumptions about the picture, then see if price appears to be drawing it or not.
So, let’s switch to a bar chart, pretend there was nothing before the start of the chart and see how it might have developed:
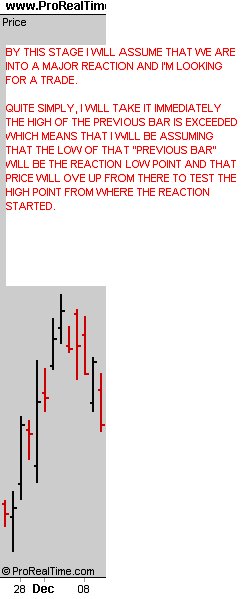
Fig 3
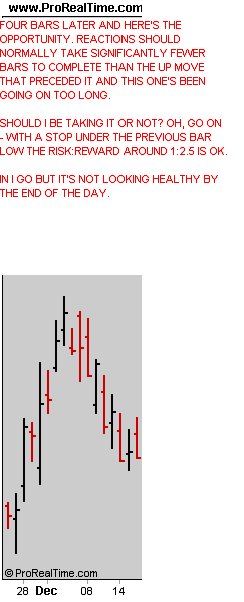
Fig 4
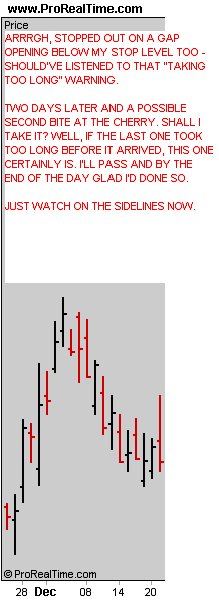
Fig 5
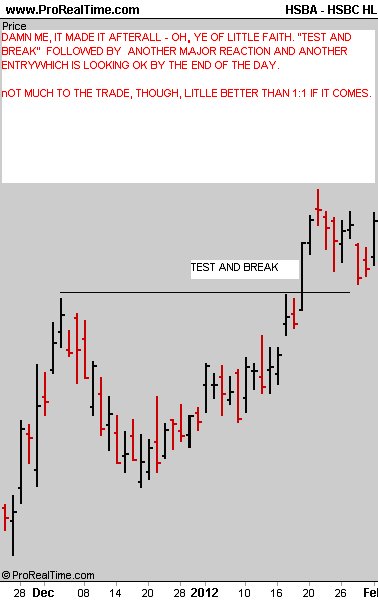
Fig 6
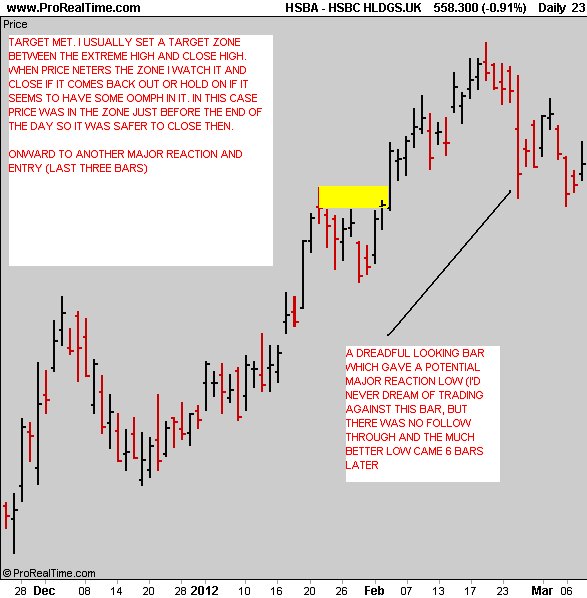
Fig 7
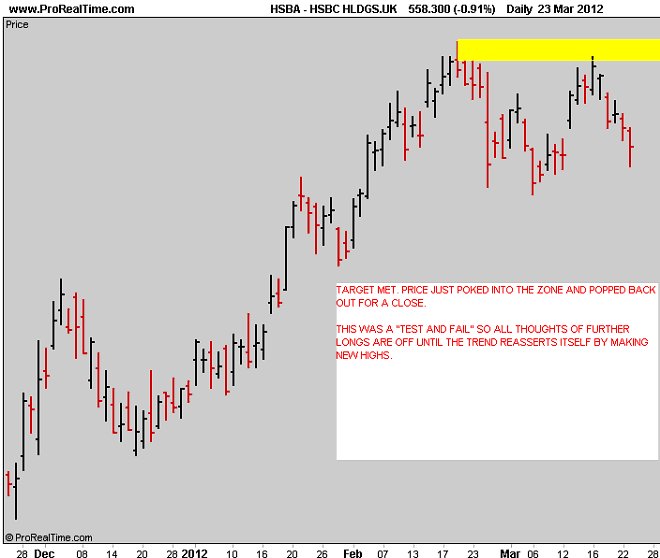
Fig 8
……and there you have it. Assumptions, based on basic TA principles with some price action type TA to aid my decisions” finished Jack. “I guess I’ve not said much about money management, but I’ve taken up enough of your time already.”
Well, thanks Jack, but does TA work or not? I’ve got this damn argument on Trade2Win to get back to.
Hope you enjoyed Jack’s tale.
jon
"Works", laughed Jack, “It’s just a tool, you know, which just as much ‘works’ as Alexandros’s hammer and chisel did in sculpting the Venus de Milo. No, dear boy, it’s you and me that ‘works’ not the tool.”
I thought that sounded somewhat fanciful so I asked Jack how he used TA as a tool. “I use it to make assumptions about what price might do,” he said, “but it’s how I manage the assumptions and the money that determines whether my account increases or decreases over time. Let me explain.
First, some obvious stuff, but bear with me. Price moves in mysterious ways, but it does have a certain rhythm about it. Don’t take my word for, just open a daily chart of an instrument of your choice, convert it to a line and close point chart, then look for where your instrument has been in trend phase for a few months. Just observable, nothing fancy, with line running bottom left to top right (I’ll talk about up trends for clarities sake, but the same applies to down trends). What do you see? I guarantee you will not be looking at a straight line, or one where every closing point is higher than the one before. You will see something that looks like this because forward and back, forward and back is the rhythm of the market:

Fig 1
What you observe are counter-trend reactions, some just minor pull backs, some rather more severe and some major reactions. You will also observe that, when a major reaction is over, price first has to recover the lost ground to the point of the high where the reaction started. My assumption is that price will do just that and either test and break that previous high to continue its upward trend or test and fail resulting in a trend reversal or, at least, a significant down move. It is this assumption that sets the framework of my trading where I seek to capture that recovery move, so long as the reward is commensurate with the risk I am prepared to run.
I prefer to take these bits from the trend rather than suffer the major reactions, the last of which almost inevitably continues into a full reversal, wiping out much that had been gained had I stuck with the trend.
Here’s a picture to demonstrate:

Fig 2
There you are, then, easy isn’t it? Buy the major reaction low, sell at previous high. Next year, Rodney, we’ll all be millionaires!! Well, yes, it is easy when you’ve got the whole picture spread out before you like that, but you can’t trade it because it’s history and about as relevant as reading the form to work out what is going to win the Grand National after you’ve watched the winner being paraded through the streets.
What I do know, though, is how the picture MUST look if the trades that I take as we go along are to be successful and, with less certainty, how price has to move to draw it. So I must make assumptions about the picture, then see if price appears to be drawing it or not.
So, let’s switch to a bar chart, pretend there was nothing before the start of the chart and see how it might have developed:

Fig 3

Fig 4

Fig 5

Fig 6

Fig 7

Fig 8
……and there you have it. Assumptions, based on basic TA principles with some price action type TA to aid my decisions” finished Jack. “I guess I’ve not said much about money management, but I’ve taken up enough of your time already.”
Well, thanks Jack, but does TA work or not? I’ve got this damn argument on Trade2Win to get back to.
Hope you enjoyed Jack’s tale.
jon
Last edited by a moderator:
