As we come into the growing season for many of our agricultural Commodities, there will be numerous opportunities to trade the volatility created by weather, crop estimates and other fundamentals. I mention the agricultural markets because they offer some of the finest opportunities. However, other markets can be spread, also.
For example, here are just a few:
Spreading offers the Futures trader an opportunity to trade these markets with less capital than on outright Futures position, while being hedged at the same time. This hedge does not mean you cannot lose money, it simply implies you are long one Futures contract at the same time you are short another in a related market. All of these Spreads are traded on exchanges and can be implemented by most Futures trading platforms.
Since Spread trading involves trading two related markets, you will be required to pay a round turn commission for each contract involved. If you place an order for one spread, you are actually dealing with 2 contracts so expect to pay 2 round turn commissions.
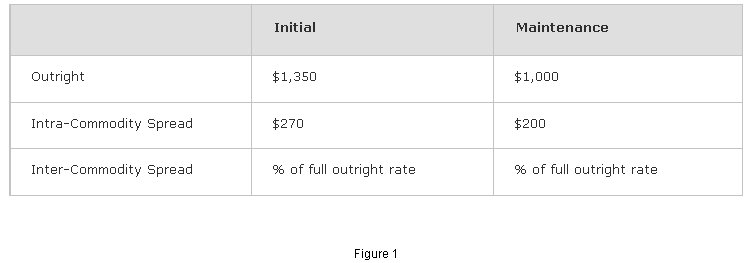
The exchanges recognize many of these Inter-Commodity Spreads and will offer you a reduced margin to hold the position. Margin is the good faith money you deposit with your broker to assure you will be responsible for any losses that may occur. This allows the trader to get more leverage with less money. Intra-Commodity Spreads are even less margin than Inter-Commodity Spreads. To find the margin required for the Futures contract you are going to trade, visit the exchange website where the Commodity is traded and look up the Performance Bond/ Margin requirements. Here is an example of margin requirements for trading Corn:

Figure 1 shows that if you are trading one Corn contract either short or long, you would have to initially have $1,350 in your trading account per contract. If you were to place an Intra-Commodity Spread of May Corn / December Corn, you would only be required to have $270 initially in your account per Spread. To place an Inter-Commodity Spread, you would have to figure out what the full margins are for both contracts and use a percentage of that full margin as your initial margin.
Example of Inter-Commodity Spread margin.
Outright Rates:
Corn $1,350
Soybeans $3,713
Currently the CME Group exchange requires a 65% Inter-Commodity rate for this Spread.
$1,350 + $3,713 = $5,063 Total margin before Spread credit
With Inter-Commodity Spread credit there is a savings of $3,291 (5,063 * .65) compared to trading two outright Futures positions.
The amount needed to trade this Spread would be $1,772 (5,063 * .35)
You can see from the initial capital needed to trade these markets that you can participate for a fraction of the outright Futures contracts. Obviously, you still need a trading account size that can withstand some draw downs, but you can see how you have the opportunity to trade perhaps two Spreads for the price of one outright Futures contract. This is helpful when it comes to scaling out of positions at different price levels as the market moves in your direction.
Calculating these Spreads is a little different than your ordinary Intra-Commodity Spread. The reason being is you are dealing with two different, but related markets that will likely have a different tick value for each price change. When you trade a Corn Intra-Commodity Spread, both the short and long contracts will trade at $12.50 per tick. The math to calculate this Spread is simply to subtract the last price of the short contract from the last price of the long contract. Each time this Spread trades its minimum tick, you will see a $12.50 change in equity. To plot this on a chart would look like this CZ10 - CU10 (December Corn - September Corn).
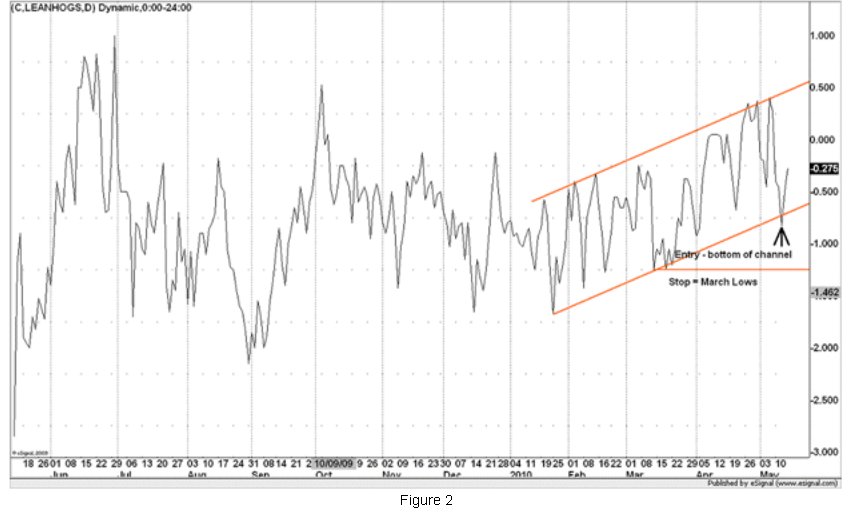
Figure 2 shows an Intra-Commodity Spread on a chart. Notice the price scale is the price of the August Lean Hog - July Lean Hog. I had been waiting for this Spread to come back to the lower channel. Let's see if it has any follow-through.

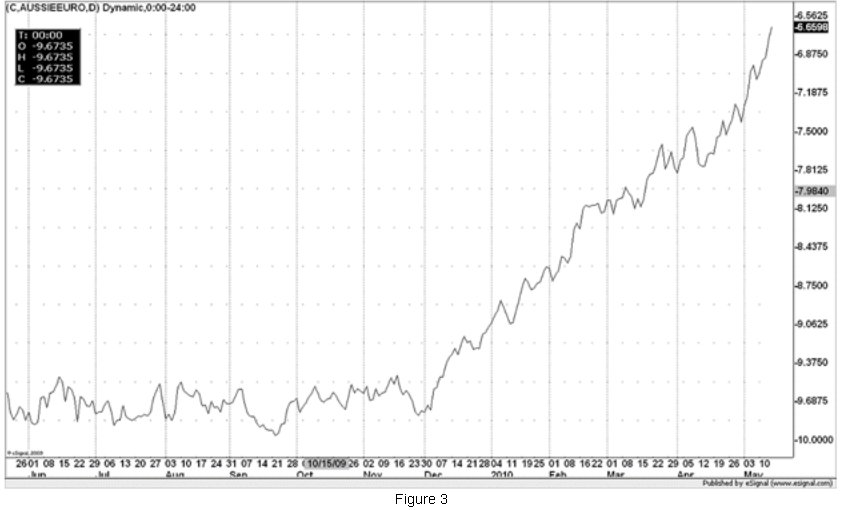
Inter-Commodity Spreads require a little more math in the equation in order to properly plot the price and see in real time what your net profit or loss is. When you have two markets that trade with different tick intervals like the Aussie Dollar ($10 per tick) and the Euro Currency ($12.50 per tick), you have to use a simple formula to build the charts. Figure 3 shows this chart. Notice the price scale and how it appears to be much different than Figure 2 was

This type of Spread is called an "Equity Spread" when the markets involved have different tick values. Since we cannot view these two markets equally, we have to use the following formula to calculate the "Equity Price" we will trade. We will use the same formula as we do to identify the Futures contract value (tick size * last price of Futures Contract). We can get the tick values from the exchange website under contract specifications for each Commodity traded.
(6A M10 * 10) - (6E M10 * 12.50) = Equity Spread
To plot our Equity Spread, we will take the Aussie Dollar Futures price and multiply by $10. Then do the same with the Euro Currency except we will multiply by $12.50. Once this is done, we will simply subtract the Euro Currency contract value from the Aussie Dollar contract value and this creates our Equity Spread value to plot on the chart. The price scale now reflects the net difference between the total contract values of both Commodities. Now in real time, you can see exactly how much your Spread is worth.
Inter-Commodity Spread charts are just like Intra-Commodity Spread charts in terms of price direction. If the price is going higher, you are profiting in the Spread. If the price is going lower, you are losing in the Spread (yes, you can lose money trading Spreads).
The exchanges recognize many different Spreads and each is listed on the Performance Bond/Margin page that will give you reduced margins. You can trade a Spread that is not recognized by the exchange, but you will not receive the reduced margin rate and you will be required to post full margin for both contracts. This eliminates the advantage of less capital to trade Spreads.
Now you have seen exactly how to view and calculate two types of popular Spread types in the Futures markets. The Inter-Commodity Spreads have a little more risk associated with them than the Intra-Commodity Spreads do. This is due to having two different markets involved in the Spread, which means both markets could actually go against your position.
Spread trading can offer many new opportunities to the Futures trader. For swing trading, these Spreads can help you sleep a little better at night not worrying about gaps. As with any investment there is risk in Spreads, but the rewards can be beneficial for the sometimes slower pace of the Spreads.
"I wanted to change the world, but I have found that the only thing one can be sure of changing is oneself" Aldous Huxley
May the markets reward you for all of your efforts,
For example, here are just a few:
- Ten Year Treasury Note / Thirty Year Treasury Bond
- Live Cattle / Lean Hogs
- Euro FX / Aussie Dollar
- Gold / Silver
Spreading offers the Futures trader an opportunity to trade these markets with less capital than on outright Futures position, while being hedged at the same time. This hedge does not mean you cannot lose money, it simply implies you are long one Futures contract at the same time you are short another in a related market. All of these Spreads are traded on exchanges and can be implemented by most Futures trading platforms.
Since Spread trading involves trading two related markets, you will be required to pay a round turn commission for each contract involved. If you place an order for one spread, you are actually dealing with 2 contracts so expect to pay 2 round turn commissions.
The exchanges recognize many of these Inter-Commodity Spreads and will offer you a reduced margin to hold the position. Margin is the good faith money you deposit with your broker to assure you will be responsible for any losses that may occur. This allows the trader to get more leverage with less money. Intra-Commodity Spreads are even less margin than Inter-Commodity Spreads. To find the margin required for the Futures contract you are going to trade, visit the exchange website where the Commodity is traded and look up the Performance Bond/ Margin requirements. Here is an example of margin requirements for trading Corn:

Figure 1 shows that if you are trading one Corn contract either short or long, you would have to initially have $1,350 in your trading account per contract. If you were to place an Intra-Commodity Spread of May Corn / December Corn, you would only be required to have $270 initially in your account per Spread. To place an Inter-Commodity Spread, you would have to figure out what the full margins are for both contracts and use a percentage of that full margin as your initial margin.
Example of Inter-Commodity Spread margin.
Outright Rates:
Corn $1,350
Soybeans $3,713
Currently the CME Group exchange requires a 65% Inter-Commodity rate for this Spread.
$1,350 + $3,713 = $5,063 Total margin before Spread credit
With Inter-Commodity Spread credit there is a savings of $3,291 (5,063 * .65) compared to trading two outright Futures positions.
The amount needed to trade this Spread would be $1,772 (5,063 * .35)
You can see from the initial capital needed to trade these markets that you can participate for a fraction of the outright Futures contracts. Obviously, you still need a trading account size that can withstand some draw downs, but you can see how you have the opportunity to trade perhaps two Spreads for the price of one outright Futures contract. This is helpful when it comes to scaling out of positions at different price levels as the market moves in your direction.
Calculating these Spreads is a little different than your ordinary Intra-Commodity Spread. The reason being is you are dealing with two different, but related markets that will likely have a different tick value for each price change. When you trade a Corn Intra-Commodity Spread, both the short and long contracts will trade at $12.50 per tick. The math to calculate this Spread is simply to subtract the last price of the short contract from the last price of the long contract. Each time this Spread trades its minimum tick, you will see a $12.50 change in equity. To plot this on a chart would look like this CZ10 - CU10 (December Corn - September Corn).
Figure 2 shows an Intra-Commodity Spread on a chart. Notice the price scale is the price of the August Lean Hog - July Lean Hog. I had been waiting for this Spread to come back to the lower channel. Let's see if it has any follow-through.

Inter-Commodity Spreads require a little more math in the equation in order to properly plot the price and see in real time what your net profit or loss is. When you have two markets that trade with different tick intervals like the Aussie Dollar ($10 per tick) and the Euro Currency ($12.50 per tick), you have to use a simple formula to build the charts. Figure 3 shows this chart. Notice the price scale and how it appears to be much different than Figure 2 was

This type of Spread is called an "Equity Spread" when the markets involved have different tick values. Since we cannot view these two markets equally, we have to use the following formula to calculate the "Equity Price" we will trade. We will use the same formula as we do to identify the Futures contract value (tick size * last price of Futures Contract). We can get the tick values from the exchange website under contract specifications for each Commodity traded.
(6A M10 * 10) - (6E M10 * 12.50) = Equity Spread
To plot our Equity Spread, we will take the Aussie Dollar Futures price and multiply by $10. Then do the same with the Euro Currency except we will multiply by $12.50. Once this is done, we will simply subtract the Euro Currency contract value from the Aussie Dollar contract value and this creates our Equity Spread value to plot on the chart. The price scale now reflects the net difference between the total contract values of both Commodities. Now in real time, you can see exactly how much your Spread is worth.
Inter-Commodity Spread charts are just like Intra-Commodity Spread charts in terms of price direction. If the price is going higher, you are profiting in the Spread. If the price is going lower, you are losing in the Spread (yes, you can lose money trading Spreads).
The exchanges recognize many different Spreads and each is listed on the Performance Bond/Margin page that will give you reduced margins. You can trade a Spread that is not recognized by the exchange, but you will not receive the reduced margin rate and you will be required to post full margin for both contracts. This eliminates the advantage of less capital to trade Spreads.
Now you have seen exactly how to view and calculate two types of popular Spread types in the Futures markets. The Inter-Commodity Spreads have a little more risk associated with them than the Intra-Commodity Spreads do. This is due to having two different markets involved in the Spread, which means both markets could actually go against your position.
Spread trading can offer many new opportunities to the Futures trader. For swing trading, these Spreads can help you sleep a little better at night not worrying about gaps. As with any investment there is risk in Spreads, but the rewards can be beneficial for the sometimes slower pace of the Spreads.
"I wanted to change the world, but I have found that the only thing one can be sure of changing is oneself" Aldous Huxley
May the markets reward you for all of your efforts,
Last edited by a moderator:
