Before starting my career at the Chicago Mercantile Exchange, I did two things and really two things only. I played ice hockey and went to school where the focus of my studies was Biology and Genetics. I know what you're thinking, how boring... Well, I actually was and am still fascinated with the study of life so I really enjoyed those days. Around every corner of Biology, Chemistry, Genetics, and so on is another mathematical equation. After diving into this field, I quickly realized that though there were so many equations, the underlying goal of most of these equations was to quantify the forces of "change", "action", or "energy." So, one could argue that all these equations were really different variations of the same thing. For my simple mind, everything came down to Newton's simple concept of "motion into mass." Whether I was figuring out the concept of splitting a cell or how an earthquake happens, the underlying equation was quantifying motion into mass.
Knowing absolutely nothing about trading and economics when I started on the floor of the Chicago Mercantile Exchange, my first thought was that I now had to learn a whole new subject and that my prior schooling and experience had nothing to do with trading and economics. How wrong I was! Within a few weeks of working on the exchange floor, facilitating institutional order flow, all I saw was "motion into mass" everywhere. The only difference was that quantifying it in the markets was easier than what I had learned in the science books. In the trading markets, the "Mass" is the buy and sell orders or what I prefer to call, Demand and Supply. At price levels where demand exceeded supply, price rises. At price levels where supply exceeded demand, price declines. "Motion" of price is in between the supply and demand levels. We enter and exit positions at these levels and get paid in between.
My "edge" in trading is that I learned to see this on a price chart, long before I ever heard anything about "technical analysis." The focus of today's piece is to share a recent trade with you and illustrate this concept of simple "motion into mass". The goal is that this nugget of information can help you whether you are a day trader, swing trader, or longer term investor.
On June 21, 2010, the big news was that China was going to move away from pegging its currency value to the US Dollar and let it float more freely than it has in the past. This news sent the global equity markets into a strong rally. When those of us in the United States woke up, the markets were already gapping up. Below is one of many news releases that I copied for you.
News Announcement June 21, 2010:
"US equities rally up on Yuan intervention"
Mon, Jun 21 2010, 14:18 GMT
FXstreet
FXstreet.com (Barcelona) - US benchmark indices tracked the wide-spread positive tone seen in financial markets, as investors embarked upon a quest for higher yielding corners across the market place. The Asian session had previously ended on sharp rises while Europe also showed convincing results. The aggressive shift targeting upside levels is primarily attributed to the PBoC's vow to unpeg tight oscillations between the Renminbi and the US Dollar. The investing community rose its global outlook on the basis that the action taken by Chinese's officials will likely rise demand for exports and commodities.The Dow Jones Industrial Average logged in substantial gains through the first hour of trading as the index jumped above 1.30%. The Nasdaq Composite surged by more than 1% while the S&P 500 rose by 1.50%.


While the news and stock market rally was very real, I was not interested in buying like many had just done. When thinking in terms of motion into mass and supply and demand, the S&P chart above suggested the high odds trading opportunity was actually to sell short and bet on a down side move in the market. The key element here is to identify where the mass (demand and supply) is, then look at current price, and finally determine the "path of least resistance" as that is where the next "motion" (price movement) is likely to take place.
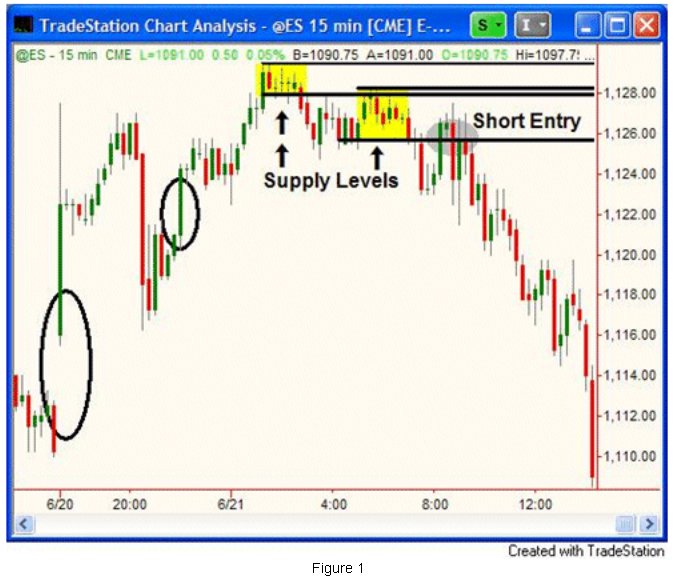
As you can see on this fifteen minute chart of the S&P futures above, The yellow areas are the supply levels. I determined this because those are price levels where price could not stay at and had to decline from. The reason price initially declined from these levels is because supply exceeds demand at these levels (mass). When we look to the left and down from those two supply levels and focus on those two circled areas on the chart, we see that there is really no significant demand or "mass." Meaning, price is likely to have a relatively easy time moving through these areas. Keep in mind a VERY important point here: I am coming to all these conclusions BEFORE I enter the trade. You must perform your analysis in advance and make your decisions before it's time to push the button, or this will never work.
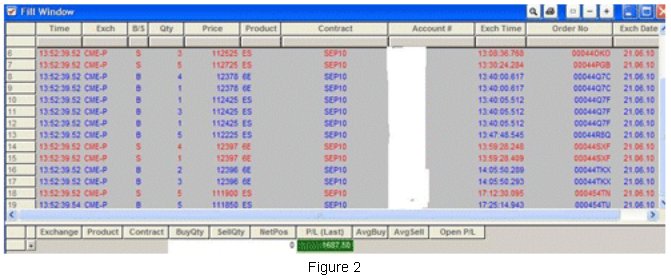
Given the position of current price (the object in motion) in relation to the location of mass, I sold short in the grey shaded area as price was likely to decline from that level. This was a small, short-term trade that led to a profit of over $1,500 in a few minutes of trading. Had the trade not worked out, which happens sometimes, the stop loss would have been just above the first supply level, keeping the risk to a minimum. Also understand that while price declined significantly, it was not even in half of that decline.

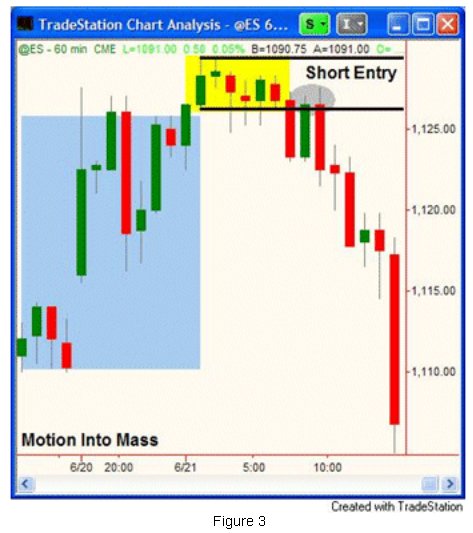
Now, let's look at the same date/trade only this time, let's look at it on a sixty minute chart. Again, the yellow area is where the strong, willing supply is and this is the "mass." When we look at the blue area, there is no significant, well-defined demand (mass). When price is in the grey circled area, the next likely move in price is down if you are thinking in terms of motion into mass, so I sold short. When trading, it is very difficult for most people to focus primarily on where the real willing buyers and sellers are. Many people will include the news or some indicators in their primary analysis. This is because most people are taught to do this, I wasn't. My focus was science, quantifying motion into mass and that sort of thing.
The information in this piece may seem a bit repetitious, but the purpose of that is to help you understand how the markets work and one way of attaining low risk, high reward, and high probability profits when speculating in markets.
I Hope this was helpful, have a great day.
Knowing absolutely nothing about trading and economics when I started on the floor of the Chicago Mercantile Exchange, my first thought was that I now had to learn a whole new subject and that my prior schooling and experience had nothing to do with trading and economics. How wrong I was! Within a few weeks of working on the exchange floor, facilitating institutional order flow, all I saw was "motion into mass" everywhere. The only difference was that quantifying it in the markets was easier than what I had learned in the science books. In the trading markets, the "Mass" is the buy and sell orders or what I prefer to call, Demand and Supply. At price levels where demand exceeded supply, price rises. At price levels where supply exceeded demand, price declines. "Motion" of price is in between the supply and demand levels. We enter and exit positions at these levels and get paid in between.
My "edge" in trading is that I learned to see this on a price chart, long before I ever heard anything about "technical analysis." The focus of today's piece is to share a recent trade with you and illustrate this concept of simple "motion into mass". The goal is that this nugget of information can help you whether you are a day trader, swing trader, or longer term investor.
On June 21, 2010, the big news was that China was going to move away from pegging its currency value to the US Dollar and let it float more freely than it has in the past. This news sent the global equity markets into a strong rally. When those of us in the United States woke up, the markets were already gapping up. Below is one of many news releases that I copied for you.
News Announcement June 21, 2010:
"US equities rally up on Yuan intervention"
Mon, Jun 21 2010, 14:18 GMT
FXstreet
FXstreet.com (Barcelona) - US benchmark indices tracked the wide-spread positive tone seen in financial markets, as investors embarked upon a quest for higher yielding corners across the market place. The Asian session had previously ended on sharp rises while Europe also showed convincing results. The aggressive shift targeting upside levels is primarily attributed to the PBoC's vow to unpeg tight oscillations between the Renminbi and the US Dollar. The investing community rose its global outlook on the basis that the action taken by Chinese's officials will likely rise demand for exports and commodities.The Dow Jones Industrial Average logged in substantial gains through the first hour of trading as the index jumped above 1.30%. The Nasdaq Composite surged by more than 1% while the S&P 500 rose by 1.50%.


While the news and stock market rally was very real, I was not interested in buying like many had just done. When thinking in terms of motion into mass and supply and demand, the S&P chart above suggested the high odds trading opportunity was actually to sell short and bet on a down side move in the market. The key element here is to identify where the mass (demand and supply) is, then look at current price, and finally determine the "path of least resistance" as that is where the next "motion" (price movement) is likely to take place.
As you can see on this fifteen minute chart of the S&P futures above, The yellow areas are the supply levels. I determined this because those are price levels where price could not stay at and had to decline from. The reason price initially declined from these levels is because supply exceeds demand at these levels (mass). When we look to the left and down from those two supply levels and focus on those two circled areas on the chart, we see that there is really no significant demand or "mass." Meaning, price is likely to have a relatively easy time moving through these areas. Keep in mind a VERY important point here: I am coming to all these conclusions BEFORE I enter the trade. You must perform your analysis in advance and make your decisions before it's time to push the button, or this will never work.
Given the position of current price (the object in motion) in relation to the location of mass, I sold short in the grey shaded area as price was likely to decline from that level. This was a small, short-term trade that led to a profit of over $1,500 in a few minutes of trading. Had the trade not worked out, which happens sometimes, the stop loss would have been just above the first supply level, keeping the risk to a minimum. Also understand that while price declined significantly, it was not even in half of that decline.

Now, let's look at the same date/trade only this time, let's look at it on a sixty minute chart. Again, the yellow area is where the strong, willing supply is and this is the "mass." When we look at the blue area, there is no significant, well-defined demand (mass). When price is in the grey circled area, the next likely move in price is down if you are thinking in terms of motion into mass, so I sold short. When trading, it is very difficult for most people to focus primarily on where the real willing buyers and sellers are. Many people will include the news or some indicators in their primary analysis. This is because most people are taught to do this, I wasn't. My focus was science, quantifying motion into mass and that sort of thing.
The information in this piece may seem a bit repetitious, but the purpose of that is to help you understand how the markets work and one way of attaining low risk, high reward, and high probability profits when speculating in markets.
I Hope this was helpful, have a great day.
Last edited by a moderator:
