Of all the facets of trading, the first that a new trader must learn before he can engage the markets with any degree of confidence is the identification of low risk entries on a price chart. Notice that not just any entry will do, only those offering the biggest reward for the least amount of loss potential.
If you've ever read about or had the chance to chat with any successful trader, you will find one common thread: They all (without exception) have an edge based on low risk entries.
What defines a low risk entry? I define it as the following: The price level where a trader can expose the least amount of capital to prove whether his edge will work. I tell students to look for these areas by identifying "the line in the sand" or "drop-dead level" where price has to hold. These are generally found at prior inflection points on the chart.
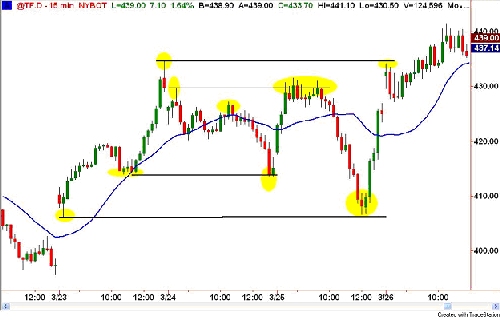
Specifically, inflection points can be spotted by looking for those price levels where there was a clear change of direction. In other words, where was the dominance of either the buyers or sellers relinquished? Moreover, the more powerful the reversal, the more important that point becomes on the retest. The chart below depicts some of these turning points in TF (Russell 2000 E-mini).

Also noteworthy is the fact that the first time these levels were "tested," not only did they provide low risk trade setup, but they also held, and reversed a high percentage of the time.
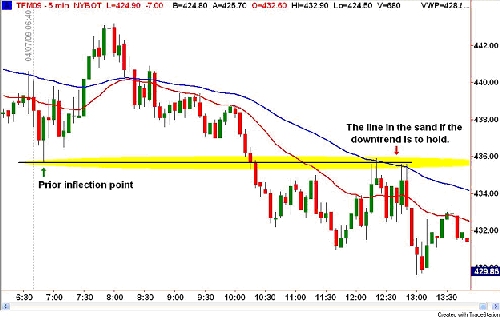
I've used the chart below to illustrate this premise. If we use the 60-period exponential moving average as a dynamic trend line, coupled with the resistance level as the "line in the sand," we can then determine that the breaching of these would signal a change of trend, and thus provide the entry, and the buy stop (risk to be assessed).

Depending on how much risk one is comfortable in assuming, a limit order can be placed near or very close (within a few ticks) to that price.
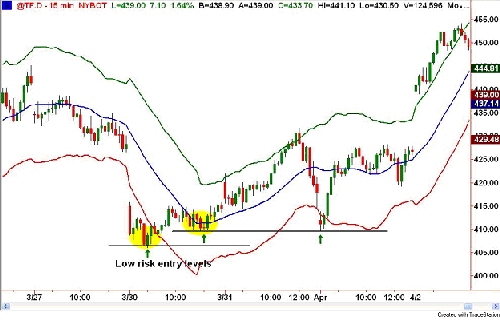
In another example, the TF (E-mini Russell 2000) in the chart below has pierced through the lower Keltner band. This (in my work) is signaling an extended market in which the odds of a reversal are heightened. If we look to the right, we spot two previous inflection points (highlighted in yellow). These would be deemed support areas that should attract buyers. These, again, are the low risk areas to place orders. Since there are two levels, you're probably asking yourself, which one should I buy? Given that we know that one of them has a very high probability of holding, and our risk will be modest, we have to try it at both price levels.

As we can see in the chart, the first level did hold, and the trade worked very nicely.
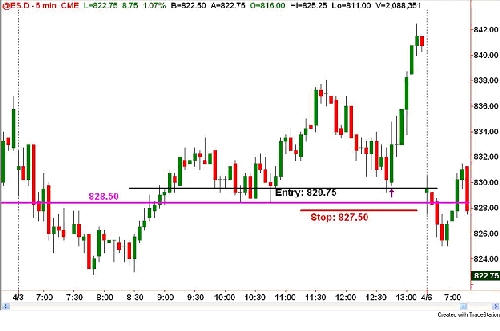
In this final illustration, I'm using a trade I setup for the students in the last E-mini Futures class I taught in Irvine. The rationale behind this trade was that the ES had been trending higher, albeit in a choppy fashion; the price point highlighted was the last major low, which had to be sustained if the buyers were to preserve control. In the chart of the ES (E-mini S&P), Figure 4, the magenta-colored line is the last boundary; the entry was done a little above, with a snug stop just below that spot, and the trade was exited on the close of the regular session.

Suffice it to say, not all trades will work as well as these did, but the key here is when they don't pan out, the losses will be trifle compared to the profit potential.
Once a trader learns the skill of identifying these levels, the biggest challenge is putting on the trades. Why do I say this? Well, all of these trades are being placed when price is either retracing or the market is moving strongly into one of these areas.
If you look closely at all the charts, you were buying into a series of red candles or shorting into a sequence of green candles (some of them very tall); psychologically, this doesn't sit well with most non-professional traders. Only by knowing probabilities and accepting risk can a trader place these trades with self-assurance.
The other issue is patience. These setups don't come every minute, or five minutes for that matter - more like two or three times a day (maybe). This is where the phrase "if you can't spot it, don't trade it" becomes relevant.
Indeed, this style of trading perhaps is not for everyone, but regardless of your method, identifying and executing low risk entries are the hallmark of a consistently profitable trader.
Until next time, I hope everyone has a great trading week.
If you've ever read about or had the chance to chat with any successful trader, you will find one common thread: They all (without exception) have an edge based on low risk entries.
What defines a low risk entry? I define it as the following: The price level where a trader can expose the least amount of capital to prove whether his edge will work. I tell students to look for these areas by identifying "the line in the sand" or "drop-dead level" where price has to hold. These are generally found at prior inflection points on the chart.
Specifically, inflection points can be spotted by looking for those price levels where there was a clear change of direction. In other words, where was the dominance of either the buyers or sellers relinquished? Moreover, the more powerful the reversal, the more important that point becomes on the retest. The chart below depicts some of these turning points in TF (Russell 2000 E-mini).

Also noteworthy is the fact that the first time these levels were "tested," not only did they provide low risk trade setup, but they also held, and reversed a high percentage of the time.
I've used the chart below to illustrate this premise. If we use the 60-period exponential moving average as a dynamic trend line, coupled with the resistance level as the "line in the sand," we can then determine that the breaching of these would signal a change of trend, and thus provide the entry, and the buy stop (risk to be assessed).

Depending on how much risk one is comfortable in assuming, a limit order can be placed near or very close (within a few ticks) to that price.
In another example, the TF (E-mini Russell 2000) in the chart below has pierced through the lower Keltner band. This (in my work) is signaling an extended market in which the odds of a reversal are heightened. If we look to the right, we spot two previous inflection points (highlighted in yellow). These would be deemed support areas that should attract buyers. These, again, are the low risk areas to place orders. Since there are two levels, you're probably asking yourself, which one should I buy? Given that we know that one of them has a very high probability of holding, and our risk will be modest, we have to try it at both price levels.

As we can see in the chart, the first level did hold, and the trade worked very nicely.
In this final illustration, I'm using a trade I setup for the students in the last E-mini Futures class I taught in Irvine. The rationale behind this trade was that the ES had been trending higher, albeit in a choppy fashion; the price point highlighted was the last major low, which had to be sustained if the buyers were to preserve control. In the chart of the ES (E-mini S&P), Figure 4, the magenta-colored line is the last boundary; the entry was done a little above, with a snug stop just below that spot, and the trade was exited on the close of the regular session.

Suffice it to say, not all trades will work as well as these did, but the key here is when they don't pan out, the losses will be trifle compared to the profit potential.
Once a trader learns the skill of identifying these levels, the biggest challenge is putting on the trades. Why do I say this? Well, all of these trades are being placed when price is either retracing or the market is moving strongly into one of these areas.
If you look closely at all the charts, you were buying into a series of red candles or shorting into a sequence of green candles (some of them very tall); psychologically, this doesn't sit well with most non-professional traders. Only by knowing probabilities and accepting risk can a trader place these trades with self-assurance.
The other issue is patience. These setups don't come every minute, or five minutes for that matter - more like two or three times a day (maybe). This is where the phrase "if you can't spot it, don't trade it" becomes relevant.
Indeed, this style of trading perhaps is not for everyone, but regardless of your method, identifying and executing low risk entries are the hallmark of a consistently profitable trader.
Until next time, I hope everyone has a great trading week.
Last edited by a moderator:
