You are using an out of date browser. It may not display this or other websites correctly.
You should upgrade or use an alternative browser.
You should upgrade or use an alternative browser.
Articles
Filters
Show only:
Loading…
A common perception among the general retail investing and trading public is that in order to garner large profits, you must take on big risk. So where does this view come from? Who perpetuates it? And is it necessarily true that low risk trading isn’t possible?
Can Low Risk Trading Result in High Profit?
This view comes from the fact that most people perceive volatility and leverage as high risk. Therefore, if one engages in the markets during periods of high volatility using a leveraged product, the odds are very low (high risk,) but the profits can be huge if things work out. This is the common perception. In essence, the belief is that because most people are risk-averse they should settle for only mediocre returns as higher...
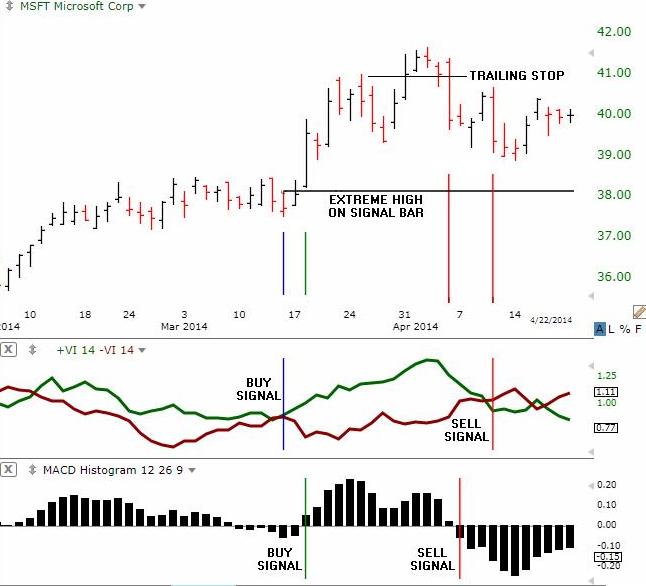
Swiss market technicians Etienne Botes and Douglas Siepman introduced the vortex indicator in the January 2010 issue of the magazine, “Technical Analysis of Stocks and Commodities.” Since then, the new technical indicator has gained traction as a reliable trend following indicator that can produce surprisingly accurate buy and sell signals. However, it will take a few more years of market testing and experience to fully evaluate the vortex indicator’s potential.
What is the Vortex Indicator?
The vortex indicator plots two oscillating lines, one to identify positive trend movement and the other to identify negative price movement. Crosses between the lines trigger buy and sell signals that are designed to capture the most dynamic...
Individuals seeking income and/or the preservation of capital often consider adding bonds to their investment portfolios. Unfortunately, most investors don't realize the potential risks that go along with an investment in a debt instrument. In this article, we'll take a look at some of the more common mistakes made - and issues overlooked - by fixed-income investors.
Interest Rate Variability
Interest rates and bond prices have an inverse relationship. As rates go up, bond prices decline, and vice versa. This means that in the period prior to a bond's redemption on its maturity date, the price of the issue will vary widely as interest rates fluctuate. Many investors don't realize this.
Is there a way to protect against such price...
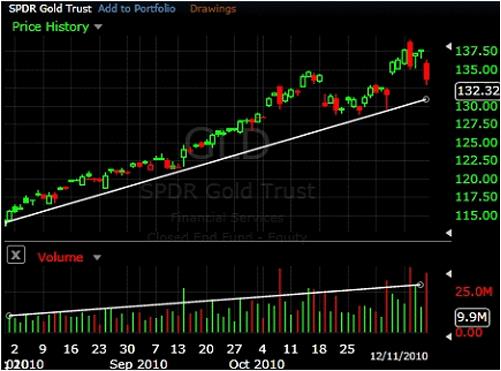
Volume is a measure of how much of a given financial asset has been traded in a given period of time. It is a very powerful tool but is often overlooked because it is such a simple indicator. Volume information can be found just about anywhere, but few traders or investors know how to use this information to increase their profits and minimize risk.
For every buyer, there needs to be someone who sold them the shares they bought, just as there must be a buyer in order for a seller to get rid of his or her shares. This battle between buyers and sellers for the best price in all different time frames creates movement while longer-term technical and fundamental factors play out. Using volume to analyze stocks (or any financial asset) can...
Have you ever felt down and out; like life itself was falling from you and it seemed like a major effort just to take care of the everyday mundane things? Of course you have it’s called being human.
No one that I have ever encountered in person or in the media has been perfect. No one has been able to lay claim to have each and every day be a shining example of everything working out just as they wanted. We all have set-backs, challenges and improvables; it is a part of life and living. OK, be that as it may, no one wants to feel dejected, depressed and overwhelmed. Today, I’d like to share a concept with you that can literally change that dark cloud over your head to reflect the bold brilliance of the sun as it illuminates your...
I was only 18 years old when I first heard of "derivatives trading" when my late father tried to explain the concept to me after having had a discussion with one of his friends. Quite honestly, I had absolutely no idea what it entailed but a part of me just knew that I wanted to do it for a living though there was no clear cut way or indication of how I would go about it.
It wasn't until roughly 10 years later that I managed to get my first break into the industry when I started working at a broking firm run by traders. They taught me many useful things and gave me a lot of insights into how things work and what to look out for etc. After almost 4 years of doing this professionally, I have come to realize how. in spite of what I've...
It's the question at the tip of every aspiring day trader’s tongue: how much money can I earn from day trading?
Since most day traders do not disclose their trading results to anyone but the tax authorities, an exact answer to how much money an average day trader makes is impossible to answer. However, there are numerous sources of information, including reliable academic studies, that offer clues on average earnings. The majority of available information does not shed a positive light on day trading. The research typically indicates that, in fact, most day traders lose money.
Day traders make money by buying stock and holding it for a short period of time--anywhere from a few minutes to a few hours--before selling it off again. Day...

One of the more interesting and helpful tools we have as traders is to use the correlation of the dollar index ($DXY) with our US dollar currency pairs. However, since non USD currencies don’t have their own index, we’ll have to make one. Let’s dive in!
First of all, the dollar index is basically showing the strength or weakness of the US dollar vs. a basket of currencies. Kind of like the S&P 500 is used to measure the direction (strength or weakness) of the average stock, we can use the dollar index in the same way for US dollar currency pair trades. Currently, the dollar index is vs. the basket of: EUR, JPY, GBP, CAD, SEK, and the CHF. The weighting will vary slightly over time, but right now the EUR is approximately 57%, the Yen...
Twitter Inc, a website and mobile platform where individuals post a 140 (and soon to be 280) character thought, or “tweet”, represents one of the newer social media resources out there. It was only a matter of time before individuals started to use it to develop stock and market trading strategies and they may be on to something.
A 2012 study by researchers at UC Riverside and Yahoo! Research Barcelona concluded that analyzing tweets about the share prices of underlying companies could improve stock trading strategies. The study, entitled “Correlating Financial Time Series with Micro-Blogging Activity” considered Twitter the foremost micro-blogging authority and created sets of filters to analyze tweets about companies and whether this...
Millions of traders test their skill in the financial markets each year, but most are destined to lose their stakes and walk away with their tails between their legs. A select few defy the odds, churning out profit after profit over long periods, building the wealth, security and wellbeing that others just dream about. So what separates these elite traders from the mediocre pack and how can you gain membership to this exclusive club?
First, let’s consider what isn’t required to become an elite trader. You don’t need to take special courses or move to Manhattan and work on Wall Street for a decade or two, although many elite traders follow that path. Nor do you need a huge stake to start your journey, because you already possess the...
The furore over high-frequency trading (HFT) was once just a preoccupation of those directly connected with Wall Street. Now the topic has gone mainstream and may soon go all the way up to the White House.
In October 2015, US Presidential hopeful Hilary Clinton's campaign proposed a tax on HFTs, a move that surprised many, since previously this was considered some quixotic notion of her rival Bernie Sanders. At a press conference in May 2015, Sanders' "Robin Hood Tax" campaign detailed the Vermont senator's proposal for a tax on trades at $0.50 per $100 for stocks and a smaller amount for certain other financial instruments. The quixotic purpose: to use the tax revenue to make US public universities free, and eradicate student debt...
The Securities and Exchange Commission (SEC) refers to a "penny stock" as a security issued by a small company that trades at less than $5 per share, and which is generally quoted over-the-counter, for instance on the OTC Bulletin Board or OTC Link (formerly known as the "pink sheets"). Penny stocks are highly speculative, and the odds of losing your entire investment in a penny stock are far greater than is hitting a home run and raking in huge profits. Still, millions of people still trade penny stocks on a daily basis. Here are 10 types of penny stock investors, whether they're found on the long side, short side or both.
1) Experienced penny stock traders
Many who thrive in the frenetic world of trading do so by carving out a niche...
As investors, we must take some risk to make any money in the markets. While it is true that cash in the bank doesn’t seem to have any risk, since it doesn’t rise and fall, changing interest rates cause its return to vary. And because the interest on cash is so low, the risk is that it won’t keep up with inflation.
Stock prices cycle up and down and they all move more or less together. In a bull market most stocks rise and in a bear market most fall, the only difference being one of degree. Precious metal prices also change in cycles, but usually not in synch with stocks and likewise for bond prices. All of these assets have risks which must be managed.
A concentrated portfolio would be one that invested in only one asset class, say...
William Delbert Gann is perhaps the most mysterious of all the famous traders in history. Known for using geometry, astrology and ancient mathematics to predict events in the financial markets and even historical events, Gann's trading strategies are still widely used today, 62 years after his death in 1955. Gann disciples claim he was one of the most successful stock and commodity traders who ever lived, while critics argue there's no concrete proof that he ever made a great fortune from speculation. Was Gann really a great trader, or was he merely a ‘guru’ who profited from selling books and running seminars?
Early Life
W.D. Gann was born in 1878 in Lufkin, Texas, the first of 11 children in an impoverished cotton farming family. He...
Every good investor knows that in order to make money on any investment, you must first understand all aspects of it, so let's look at why most trading volume is concentrated at the beginning and end of the day.
If you have ever come home from work and used your evening hours to research stocks and place trade orders for the next day, you and others like you are the reason for the first hour high volume. As soon as the stock market opens, a rush of programmed trades enters the market and is quickly filled.
Along with the trades executed for retail investors, much of the volume comes from mutual funds, hedge funds and other high volume traders. Another source is day traders who have to set their positions for the day during the first...
If you start any type of business you first have to come up with the initial seed capital to get the business off the ground. This comes with the understanding that there’s always risk because there’s never a guarantee that the business will prosper. With any traditional business we will always be subjected to the vagaries of the economy, litigation, and growing competition in whatever field we decide to venture into. This makes starting a business for many people somewhat challenging.
One of the advantages of using trading as a vehicle for generating income is that once a skill is learned, all of the aforementioned challenges that a traditional business faces no longer apply. If you learn how to trade properly, any market condition...
To engage in momentum trading, you must have the mental focus to remain steadfast when things are going your way and to wait when targets are yet to be reached. Momentum trading requires a massive display of discipline, a rare personality attribute that makes short-term momentum trading one of the more difficult means of making a profit. Let's look at a few techniques that can aid in establishing a personal system for success in momentum trading.
Techniques for Entry
The impulse system, a system designed by Dr. Alexander Elder for identifying appropriate entry points for trading on momentum, uses one indicator to measure market inertia and another to measure market momentum. To identify market inertia, you can use an exponential moving...
“Man is not a rational animal; he is a rationalizing animal.”
Robert A. Heinlein
Jeff had been here before. After working real hard, he had finally gotten funded, traded well for a while, and then it all fell apart – again. And he lost the funding he had worked so hard to get. He had cycled through this pattern a couple of times over the last several years so he was no stranger to it. Each time, he thought he had it beaten. Jeff would double down on his effort, work real hard at getting his head back together, and trade confidently.
Then “it”, ever so subtly, would creep back into his trading and, before he knew it, he started making mistakes he...
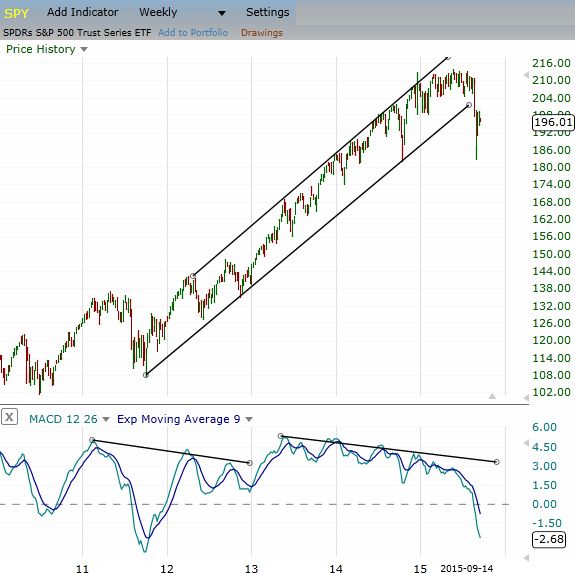
MACD divergence is discussed in most trading books and frequently cited as the reason for trend reversals, or as to why a trend could reverse. In hindsight divergence looks great; many examples can be found where a reversal was preceded by MACD divergence. Look closely though, and you'll find that many reverses aren't preceded by divergence, and often divergence doesn't result in a reversal at all. So before assuming divergence is a reliable tool to use in your trading, let's dig deeper into what MACD divergence is, what causes it, and how to improve the use of divergence.
What is Indicator Divergence?
Indicator divergence is when an oscillator or momentum indicator, such as the Moving Average Convergence Divergence (MACD) indicator...
When it comes to investing, there is no shortage of theories on what makes the markets tick or what a particular market move means. The two largest factions on Wall Street are split along theoretical lines into adherents to an efficient market theory and those who believe the market can be beat. Although this is a fundamental split, many other theories attempt to explain and influence the market - and the actions of investors in the markets. In this article, we will look at some common (and uncommon) financial theories.
Efficient Market Hypothesis
Very few people are neutral on efficient market hypothesis (EMH). You either believe in it and adhere to passive, broad market investing strategies, or you detest it and focus on picking...
Discomfort is a human condition. From conception, our system continuously undergoes cell division and development of blood, bone, tissue, nerves, muscle, internal organs and brain cells that make life outside the womb and eventual survival possible. In the first few years the level of growth is exponential; in fact, normal infants will double their birth weight by about 5 months. At puberty, like a weed, teens will undergo massive changes in their bodies as growth surges and muscles begin to take permanent shape. This is not without physical and emotional discomfort as the teen adapts incrementally to the collective mental, emotional and physical modifications. These are examples of normal growth that happens in the course of...
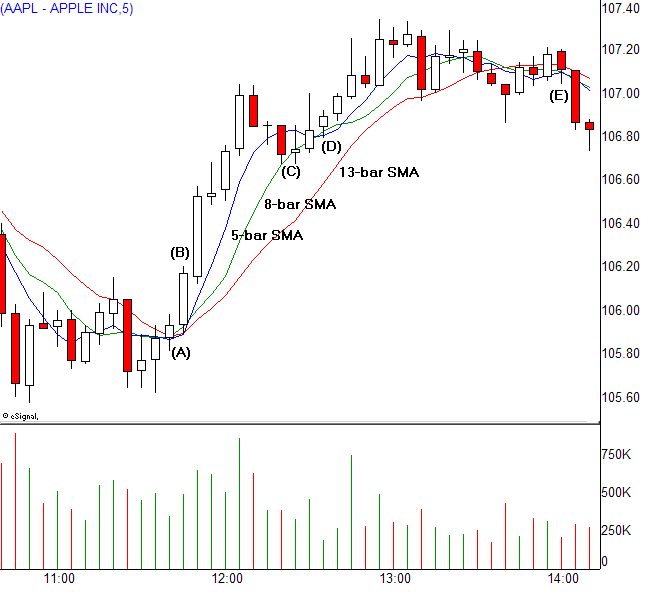
Day traders need continuous feedback on short-term price action to make lightning fast buy and sell decisions. Intraday bars wrapped in multiple moving averages serve this purpose, allowing quick analysis that highlights current risks as well as the most advantageous entries and exits. These averages work as macro filters as well, telling the observant trader the best times to stand aside and wait for more favorable conditions.
Choosing the right moving averages adds reliability to all technically-based day trading strategies, while poor or misaligned settings undermine otherwise profitable approaches. In most cases, identical settings will work in all short-term time frames, allowing the trader to make needed adjustments through the...
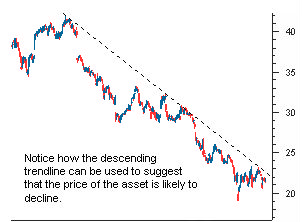
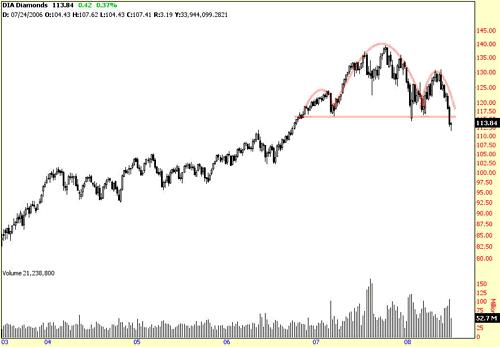
Most investors by nature will "go long" when they buy stocks. Few investors naturally will short stocks (or bet on their decline) because they really don't know what to look for. Some investors see the shorting process as somewhat counter-intuitive to the traditional investing process, since many stocks do appreciate over time. That said, there is a lot of money to be made by shorting and, in this article, we'll give you a list of signs that show when a stock might be ripe for a fall.
Technical Trends
Look at a chart of the stock you are thinking about shorting. What is the general trend? Is the stock under accumulation or distribution?
It is not uncommon to see a stock that has been in a downtrend continue to trade in that same...
In the financial markets, options are rapidly becoming a widely accepted and popular investing method. Whether they are used to insure a portfolio, generate income or leverage stock price movements, they provide advantages other financial instruments don't.
Aside from all the advantages, the most complicated aspect of options is learning their pricing method. Don't get discouraged – there are several theoretical pricing models and option calculators that can help you get a feel for how these prices are derived. Read on to uncover these helpful tools.
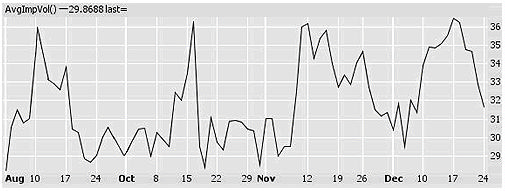
What Is Implied Volatility?
It is not uncommon for investors to be reluctant about using options because there are several variables that influence an option's premium. Don't let yourself...
One of the asset classes that can be productively used by many investors is fixed-income investments – bonds. I have been asked several times recently about the wisdom of investing in bonds in an environment of rising interest rates. That’s what I’ll address here.
The reason that the question comes up is that when interest rates go up, the value of all existing fixed-rate bonds goes down. If we expect that interest rates will go up, as most people do, then are we not saying that the value of any bonds that we invest in will go down? Could we have a net loss on the bond investments? If so, should we avoid bonds until we think that rates have peaked out? Or is there something else that can be done?
First, let’s briefly review the...
With the upsurge of investor interest in high-frequency trading (HFT), it is important for industry professionals to come up to speed with HFT terminology. A number of HFT terms have their origins in the computer networking/systems industry, which is to be expected given that HFT is based on incredibly fast computer architecture and state-of-the-art software. We briefly discuss below 10 key HFT terms that we believe are essential to gain an understanding of the subject.
Co-location
Locating computers owned by HFT firms and proprietary traders in the same premises where an exchange’s computer servers are housed. This enables HFT firms to access stock prices a split second before the rest of the investing public. Co-location has become a...
The moment that real capital is put at risk in trading, everything changes. Trading goes from an intellectual exercise where loss is abstract and not personal to a visceral experience where potential loss unhinges the rational mind and primitive emotional responses take charge of the trading mind. After experiencing real losses, the emotional survival brain even starts anticipating potential losses (rather than gains) and hijacks the trading mind BEFORE action decisions are made. If you have dealt with fear of entering a trade or fear of pulling the trigger on a perfectly good set-up, you have experienced the baffling power survival emotions have over rational thought.
Or if you have perceived that a trade could be getting away...
A "trading rut" is invariably endured by almost all traders at some point in their trading experience. A trading rut is a point in time where profits are elusive, or losses may even be mounting. These losing or unprofitable streaks can happen to anyone at any time. It may occur because the market has shifted in some way. At other times, it may be because the trader has altered a strategy or is no longer adhering to a trading plan. No matter what the reason for the slump is, there are five questions a trader can ask to help isolate the problem so changes can be initiated and hopefully a return to profitability will ensue.
The Questions
The following questions should be answered as honestly and as fully possible. Each will probe current...
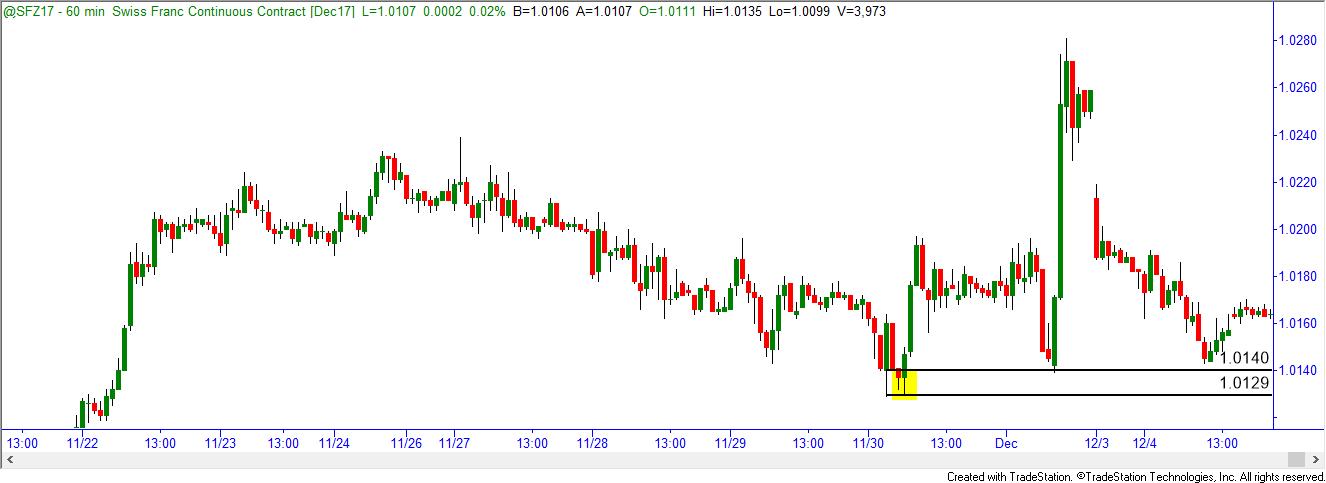
I have always found it very interesting, how many different ways people look at charts and all the different pieces of information people try to attain from a price chart. How could so many people look at the same chart and have so many different opinions? Fascinating.
With all the different schools of thought on money, markets, charts and so on, what should we really be looking for on a price chart? I mean, conventional technical analysis books have hundreds of pages in them with information on so many indicators, oscillators, chart patterns and more. With all this, there must be some edge to be gathered, right? I speak with thousands of traders around the world and everyone is trying to make something “work”. This is where I see most...